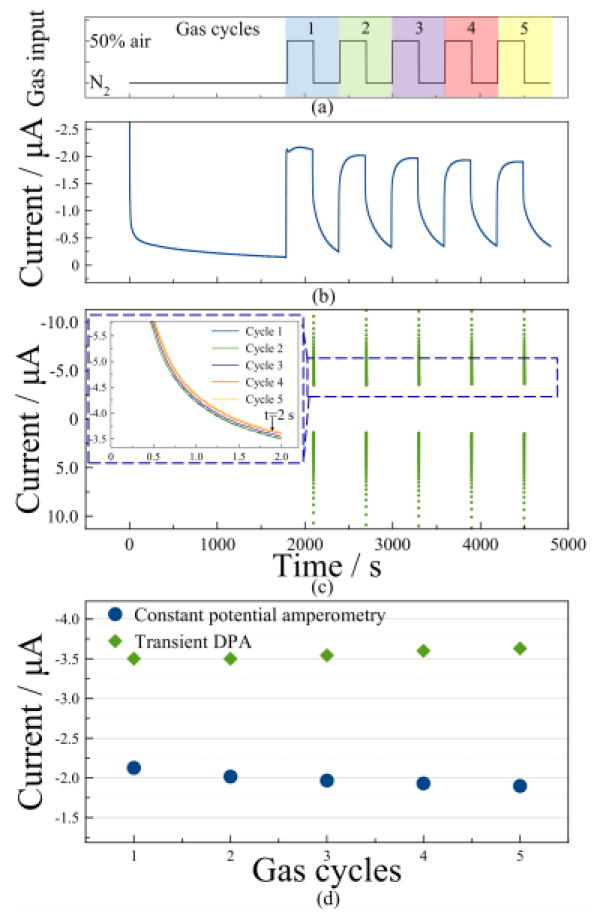
Figure 10.
Performance comparison of constant potential amperometry and transient DPA for five cycles of alternating gas concentrations between N2 and 50% air: (a) gas concentration cycles vs. time; (b) constant potential amperometry current response vs. time; (c) transient DPA current response vs. time; (d) reduction current comparison using constant potential amperometry (blue) and transient DPA (green). The inset in (c) shows the transient DPA reduction current plots overlapped for five gas cycles.

