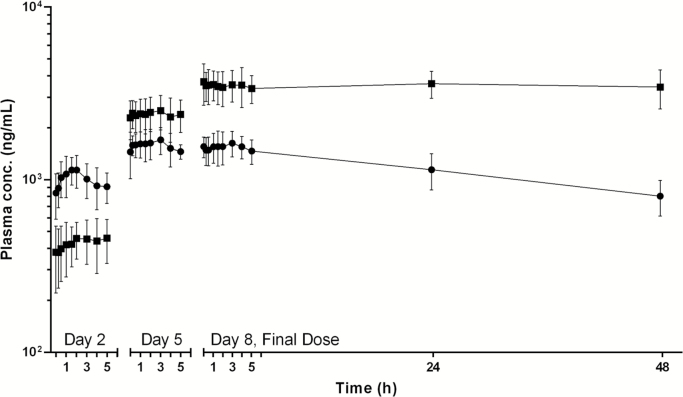
Fig. 1.
Mean plasma concentration–time profiles of mibefradil (solid circles) and its alcohol metabolite (solid squares) for the group of 6 patients receiving oral mibefradil 87.5 mg q.i.d. Pharmacokinetic sampling was performed over single dosing intervals on day 2 after administration of the fourth consecutive dose, on day 5 after the sixteenth dose, and for 48 h after the final dose on day 8. The error bars represent 1 SD of the mean concentrations.

