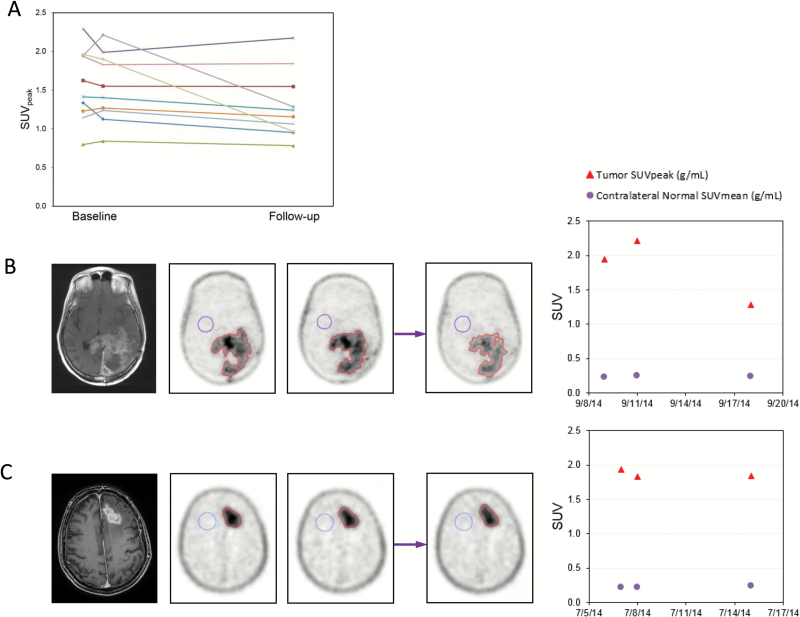
Fig. 3 .
18F-FLT PET imaging. (A) Synopsis of SUVpeak values of double-baseline and values after 7 days of treatment with mibefradil. (B and C) Examples of a patient with significant decline in SUV after 7 days of MIB (B) and a patient without a decline (C). MRI T1 contrast-enhanced image corresponding to the images of 18F-FLT PET imaging shown. Double baseline scans (left, 2 18F-FLT PET images), followed by 7 days on mibefradil and repeat imaging on day 7 (right, 18F-FLT PET images). Far right: changes in SUV values.

