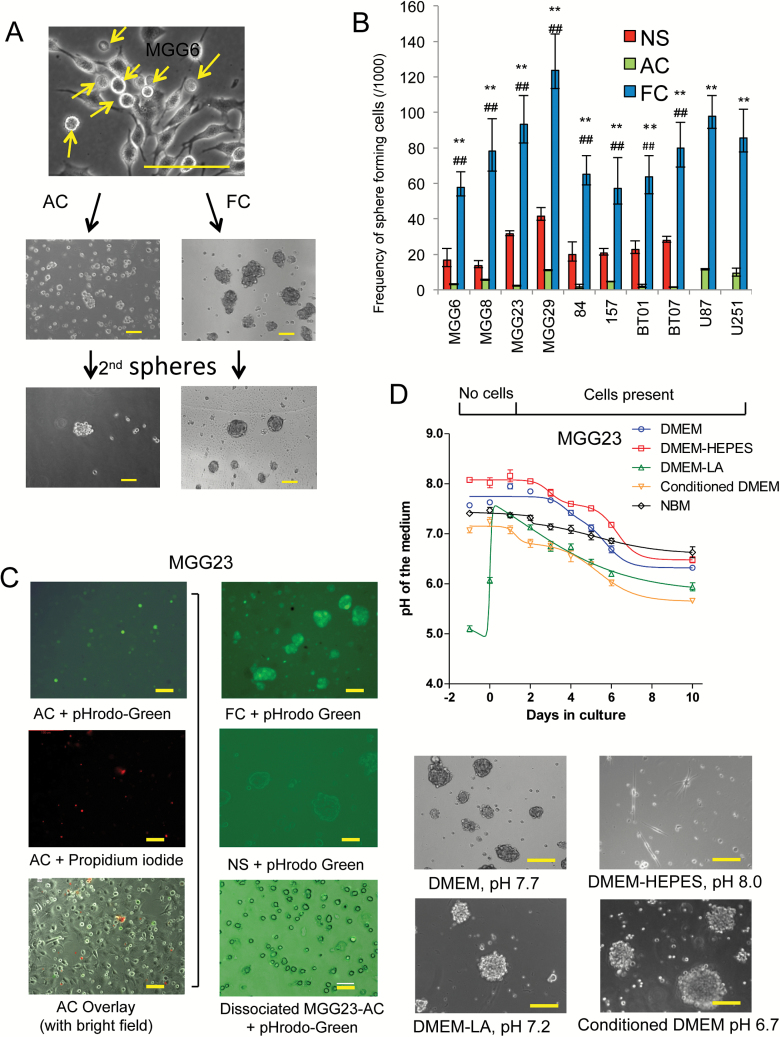
Fig. 1.
Isolation of a floating cell population from differentiated GBM cells. (A) Bright field micrographs of GSCs cultured in DMEM-FBS. A large proportion of floating cells (FC) emerge from adherent cell (AC) cultures. FC and AC were then cultured in NBM and only FC can form spheres and secondary spheres. Arrow, FC population. (B) One thousand single cells of NS, AC, and FC from 8 different GSCs and 2 GBM cell lines were cultured. One week later, extreme limiting dilution analysis (ELDA) was applied with 12 replicates. Statistics for stem cell frequencies (with 95% CIs) in FC, AC, and the corresponding NS are shown. **P < .01 FC vs AC, ##P < 0.01 NS vs FC. (C) Left panels: MGG23 cultured in DMEM-FBS and analyzed by fluorescence microscopy; upper, green showing low intracellular pH in FC; middle, propidium iodide staining; bottom, overlay with bright field image. Right: fluorescence analysis of MGG23 cells under different conditions; upper, MGG23 FC; middle, MGG23 NS; bottom, dissociated MGG23 AC. (D) Upper panel: pH in medium of MGG23 GSCs cultured in DMEM-FBS, DMEM-FBS with 25 mM of HEPES, DMEM-FBS with 15 mM lactic acid, conditioned medium, or NBM. Lower panels: bright field micrographs of FC collected under different conditions and cultured in NBM. Scale bar, 50 μm.

