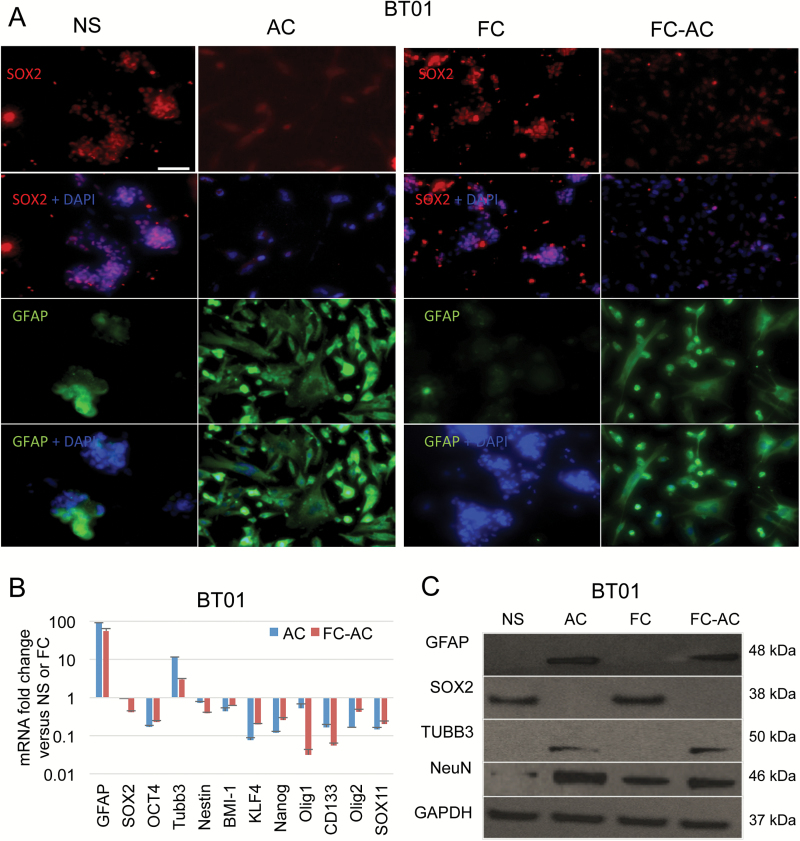
Fig. 2.
Floating cells express stem cells markers. (A) BT01 GSCs NS and their corresponding AC, as well as FC spheres and their differentiated counterpart FC-AC were stained for Sox2, GFAP, and nuclei (using DAPI). Scale bar, 100 μm. (B) mRNA expression profile of different genes in NS, FC, AC, and FC-AC from BT01 cells analyzed by qRT-PCR. Relative fold change of AC/NS and FC-AC/FC are shown. (C) Western blot analysis for GFAP, Sox2, TUBB3, NeuN, and GAPDH in cell lysates collected from NS, FC, AC, and FC-AC from BT01.

