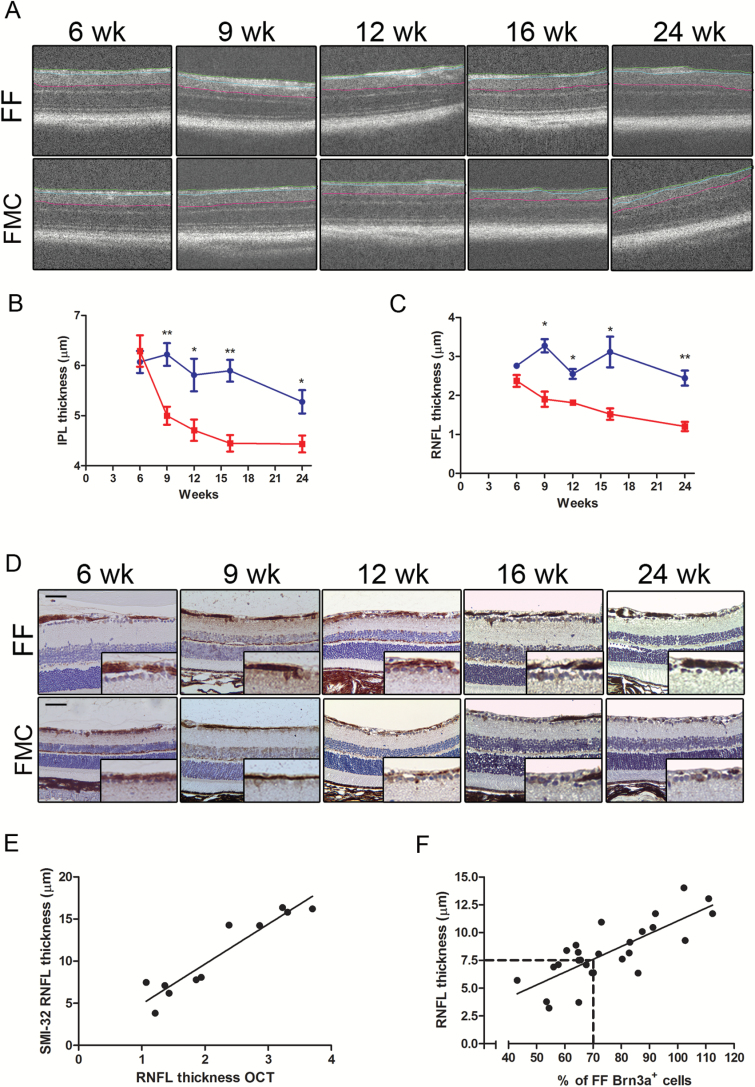
Fig. 4.
OCT is an accurate biomarker of IPL-GCL and RNFL thinning. (A) OCT measured RNFL (green to blue line) and IPL-GCL (blue to pink line) thickness. (B) IPL-GCL thinning was first detected by OCT at 9 weeks of age in FMC mice, which progressed through 24 weeks of age. (C) RNFL thickness (OCT) was decreased in FMC mice by 9 weeks of age. (D) SMI-32 staining demonstrated similar results as obtained by OCT. (E) Linear regression scatter plot of SMI-32 and OCT (R2 = 0.889). (F) Linear regression scatter plot of RGC content and RNFL thinning (R2 = 0.609). Each data point is represented by comparing direct RNFL measurements with the mean number of Brn3a+ cells in FF mice at each time point. At least 6 mice per group were included for each time point. Blue lines = FF, red lines = FMC, *P ≤ .05,**P ≤ .01, P ≤ .001. Graph denotes mean ± SEM. Scale bars = 50 µm.

