Fig. 2.
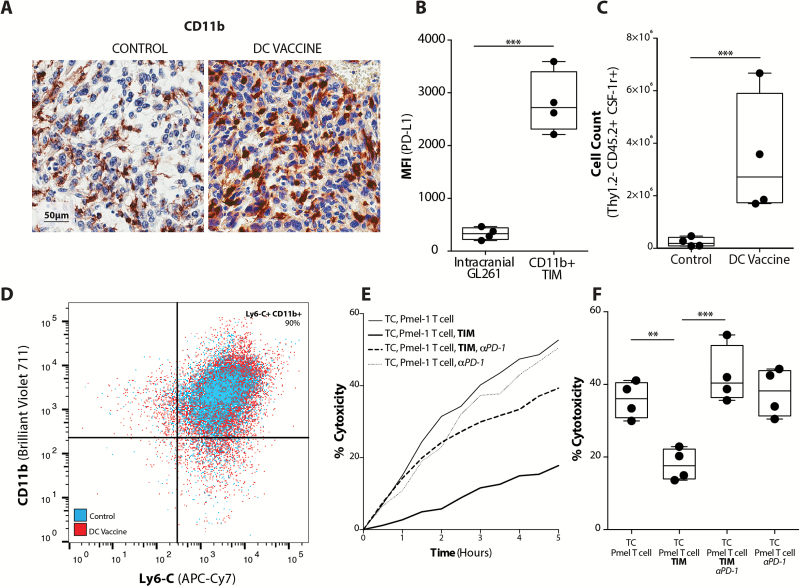
Murine glioma TIMs expand in response to vaccination to inhibit T cell-mediated tumor cytolysis. (A) CD11b IHC staining of nontreatment control and DC vaccinated tumor-bearing mice (scale bar represents 50µm). (B) Mean fluorescence intensity for PD-L1 expression on FACS intracranial GL261 gliomas (CD11b− CD3− cells) and TIMs (CD11b+ CD3−); (n = 4/group) (***P < .001). Flow cytometric characterization of (C) the absolute number of Thy1.2−, CD45.2+, CSF-1R+ cells (n = 4/group) (***P < .001), and (D) representative scatter plot of percent CD11b+, Ly6-C+ TIMs from tumors of control and DC vaccinated mice. (E) Representative xCELLigence plot of Pmel-1 T cell cytolysis of GL261-hgp100 cells (TC) over time in the absence or presence of TIMs or PD-1 mAb. (F) Quantitation of Pmel-1 T-cell induced tumor cell cytolysis at 4 hours in the absence or presence of TIMs or PD-1 mAb (n = 4) (**P < .01, ***P < .001).

