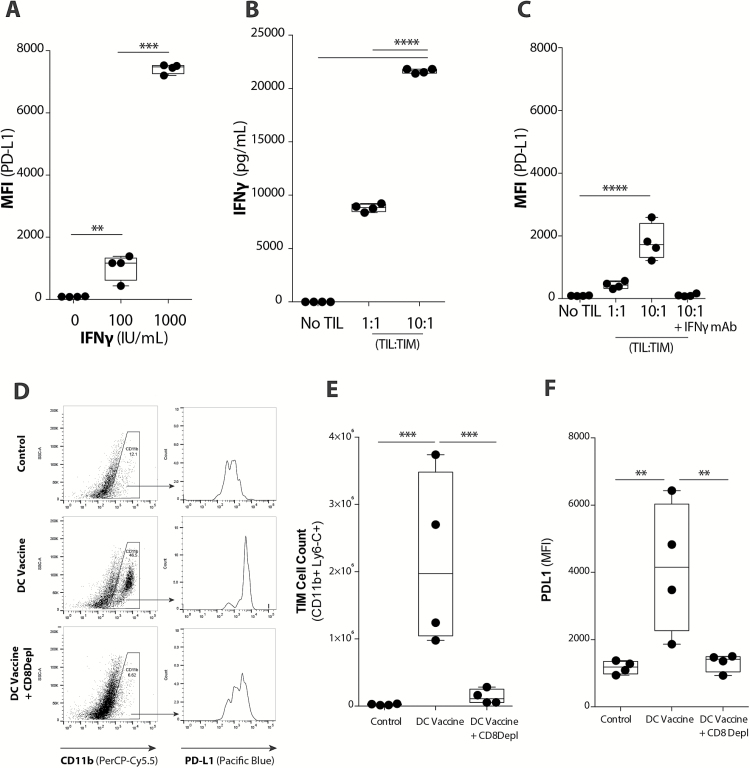
Fig. 3.
TIMs upregulate PD-L1 in response to vaccine-induced TIL population. (A) Upregulation of PD-L1 on TIMs in the presence of increasing IFNɣ concentrations was quantified with flow cytometry (n = 4/group) (***P < .001). (B) IFNɣ levels present in TIL-TIM co-cultures in vitro was quantified using a Luminex assay (n = 4/group) (****P < .0001). (C) Upregulation of PD-L1 on TIMs in the presence of increasing concentrations of TILs or blockade of IFNɣ (IFNɣ mAb) was quantified with flow cytometry (n = 4/group) (****P < .0001). (D) Representative plots demonstrate PD-L1 expression on the CD11b+ TIM population across treatment groups. (E) CD11b+ Ly6-C+ TIM cell count and (F) PD-L1 expression in non-treatment control, DC vaccinated, and DC vaccinated + CD8 mAb depletion tumor-bearing mice (n = 4/group) (**P < .01, ***P < .001). Statistical analyses were performed using Student’s t-test (A–F).

