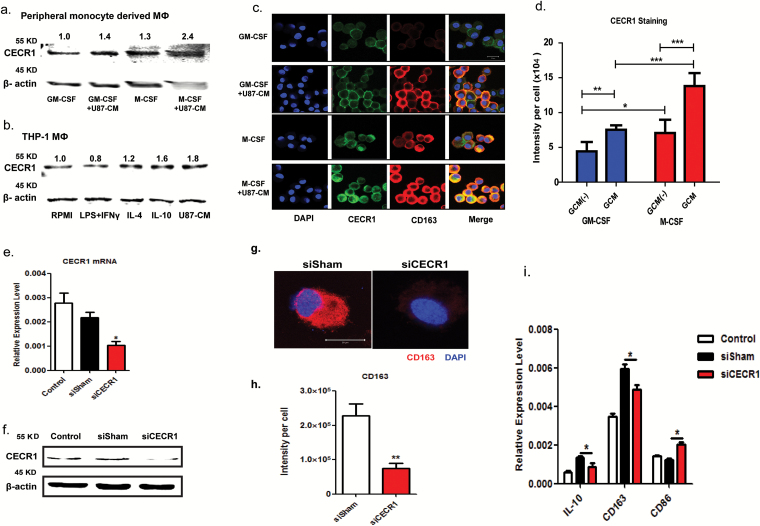
Fig. 2.
CECR1 is highly expressed in M2-like, U87 stimulated macrophage. (A) Western blot of CECR1 protein in GM-/M-CSF induced macrophages (MΦ) with/without U87-CM from 3 experiments. Numbers above bands indicate quantified levels normalized to β-actin. (B) Western blot of CECR1 protein in THP-1 derived macrophages (MΦ) in response to RPMI-1640, LPS-INFγ (M1), IL-4 (M2a), IL-10 (M2b), and U87-CM from 3 experiments. Numbers above bands indicate quantified levels normalized to β-actin. (C) Representative staining of CECR1 and CD163 in GM-CSF and M-CSF induced macrophages with/without U87 stimulation for 96 hours (scale bar: 20 µm). (D) Quantification of fluorescent signal of CECR1 per cell in different groups. Data are presented as mean ± SEM and were obtained from 3 independent experiments. *P < .05, **P < .01, ***P < .005. (E) Quantitative PCR of CECR1 in macrophages at 24 h posttransfection with CECR1 knockdown and control. Data were obtained from 3 experiments and presented as mean ± SEM; *P < .05. (F) Western blot of CECR1 protein in THP-1 macrophages at 48 h posttransfection, showing siCECR1, siSham, and nontransfected control. (G) CD163 immunostaining in siCECR1 and siSham transfected THP-1 macrophages (scale bar: 20 µm). (H) Quantified CD163 signal per cell in siCECR1 and siSham control groups are presented as mean ± SEM and were obtained from 3 independent experiments. **P < .01. (I) IL-10, CD163, and CD86 expression in siCECR1, siSham, and nontransfected THP-1 macrophages as measured by real-time qPCR. Data are presented as mean ± SEM and obtained from 3 experiments. *P < .05.

