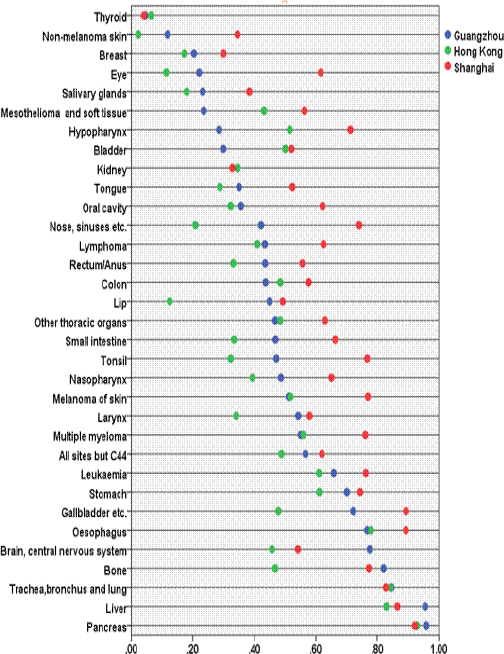
Figure 4.

Mortality: Incidence Ratios by Cancer Sites Among Guangzhou, Shanghai and Hong Kong 2010-2012.
# Hong Kong and Shanghai did not publish the M: I of every site, here only including the items both of them have.

Mortality: Incidence Ratios by Cancer Sites Among Guangzhou, Shanghai and Hong Kong 2010-2012.
# Hong Kong and Shanghai did not publish the M: I of every site, here only including the items both of them have.