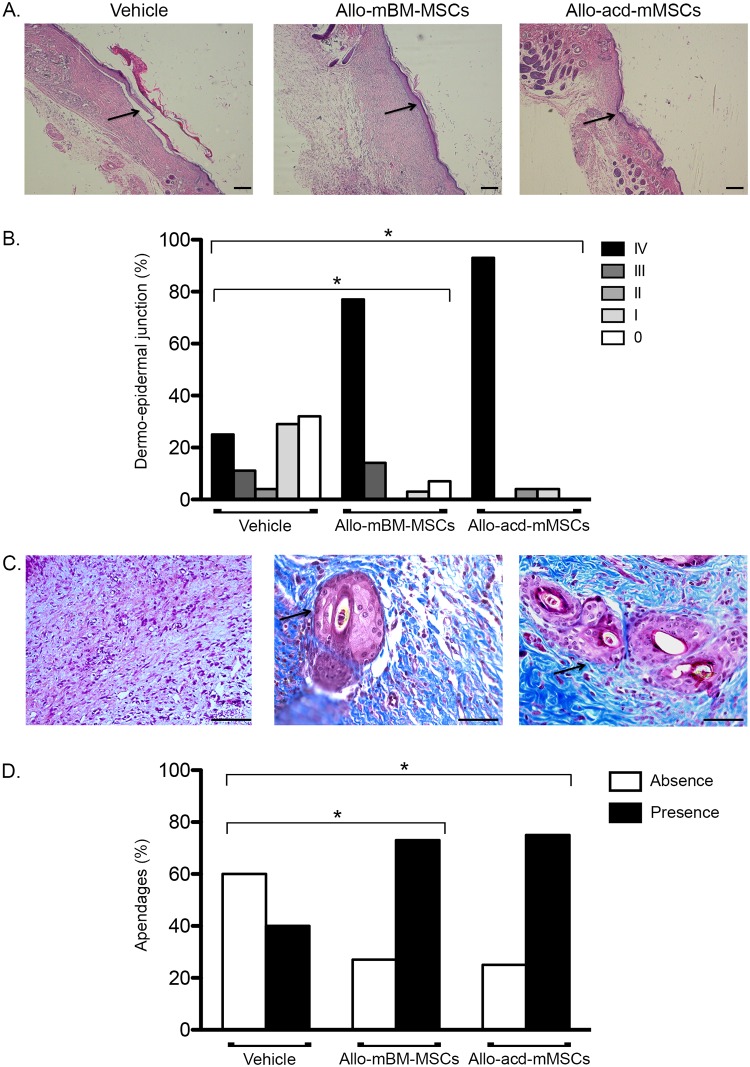
Fig 2. Histological analysis of dermo-epidermal junction and appendage-like structure formation of skin wounds 16 days after treatment with allo-mBM-MSCs and allo-acd-mMSCs in NOD mice.
(A) Wound histological representative images of haematoxylin-eosin staining showing dermo-epidermal junction, which are indicated by arrows. Scale bar = 100 μm. (B) Frequency of animals with the histological scores for dermo-epidermal junction. The score was assigned based on the junction level and was quantified using ImageJ (scores: IV: 0.1–400 pixels (complete junction), III: 401–750 pixels, II: 751–1,200 pixels, I: 1,201–2,800 pixels and 0: > 2,801 (incomplete junction). (C) Representative images of Masson’s trichrome staining illustrating appendage-like structure in the dermis indicated by arrows. Scale bar = 50 μm. (D) Frequency of animals with the score for appendage-like structure. (n = 25, 25 and 27 for vehicle, allo-mBM-MSCs and allo-acd-mMSCs groups, respectively). Analysis of Pearson’s chi-square test was used, * indicates a significant difference (p < 0.0001). Abbreviations: NOD, Non-Obese Diabetic; allo-mBM-MSCs, mouse bone marrow-derived allogeneic MSCs; allo-acd-mMSCs and mouse bone marrow acelullar derivatives allogeneic MSCs.

