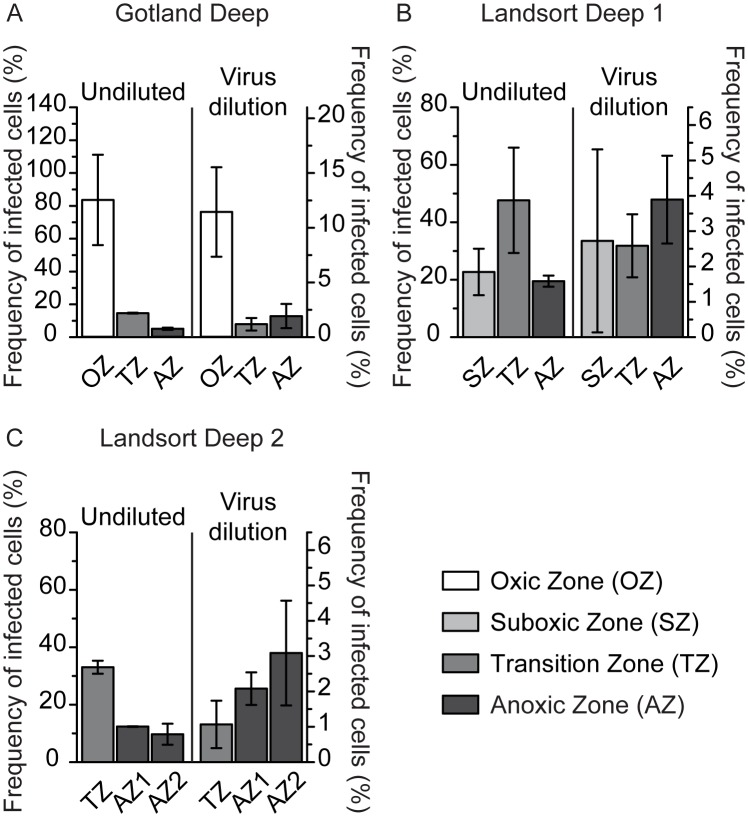
Fig 4. Frequency of lytically infected cells (FIC) in undiluted and virus dilution incubations.
The figure shows FIC at Goland Deep (A) and Landsort Deep 1 (B) and 2 (C). FIC is given as the average of duplicate incubations in the oxic (OZ), suboxic (SZ), transition (TZ), and anoxic zone (AZ). Error bars represent the range of duplicate incubations.

