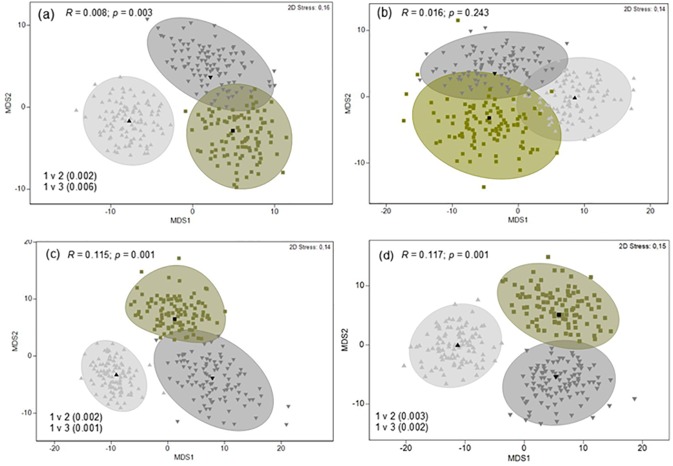
Fig 6. Metric multidimensional scaling (mMDS) ordinations of size class 2 (medium) G. cuvier dietary samples with approximate 95% region estimates fitted to bootstrap averages for decades 1 (1983–1992), 2 (1993–2003) and 3 (2004–2014).
(a) Percentage frequency of occurrence (%F), (b) Percentage mass (%M), (c) Percentage number (%N) and d) Percentage index of relative importance (%IRI). R, ANOSIM global R statistic and associated p value. Significant pairwise tests (with p value in brackets) are detailed in each figure.

