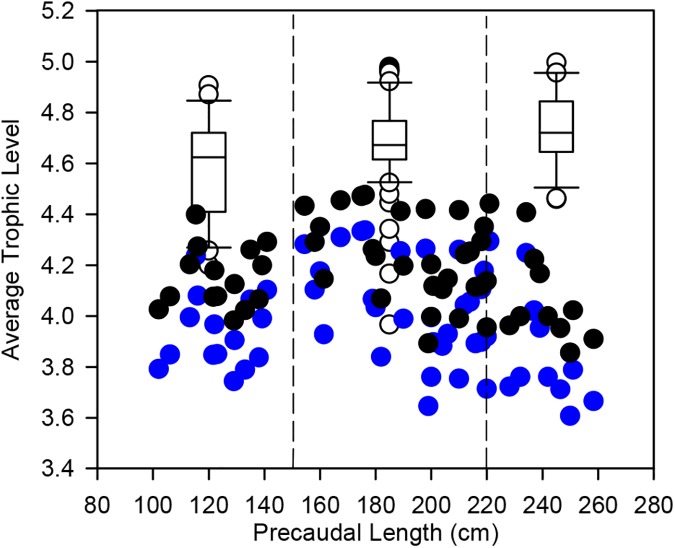
Fig 8. The relationship between TP and increasing body size of G. cuvier.
Stomach content calculated trophic position (TPSCA) for each size class is indicated by the white box. The solid black line in each box represents the median, outliers are indicated by open circles. TP estimated using a scaled δ15N framework (TPscaled) is indicated by blue circles and TP estimated using a standard additive trophic framework (TPadditive) is indicated by black circles. Vertical dashed black lines indicate the predetermined size classes of G. cuvier used in the stomach content analysis (<150 cm), medium (150–220 cm) and large (>220 cm).

