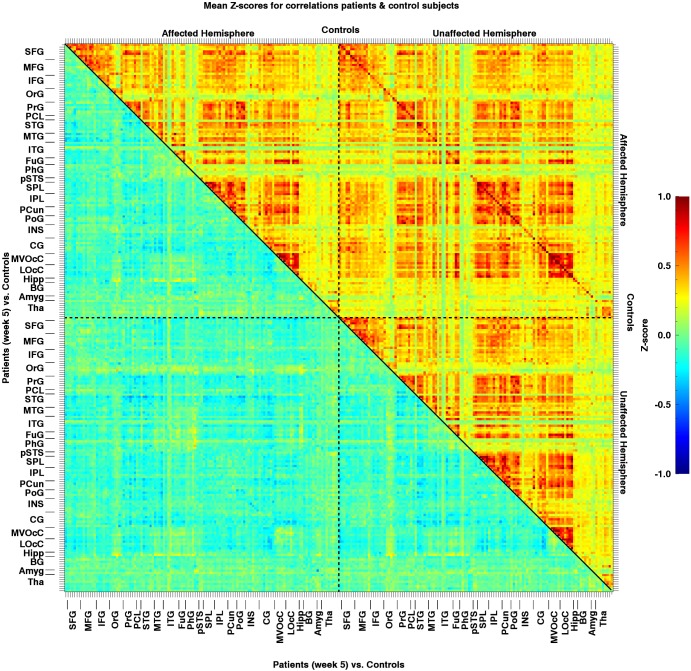
Fig 5. Mean resting-state Z-transformed correlations for patients at week 5 (n = 13) vs. control subjects (n = 13) between all regions of interest.
The matrix area on the top right of the diagonal represents the correlations for control subjects, while the area on bottom left represents the difference in correlations between patients at week 5 and healthy controls. The colour representation of the values was clipped beyond -1 and 1.

