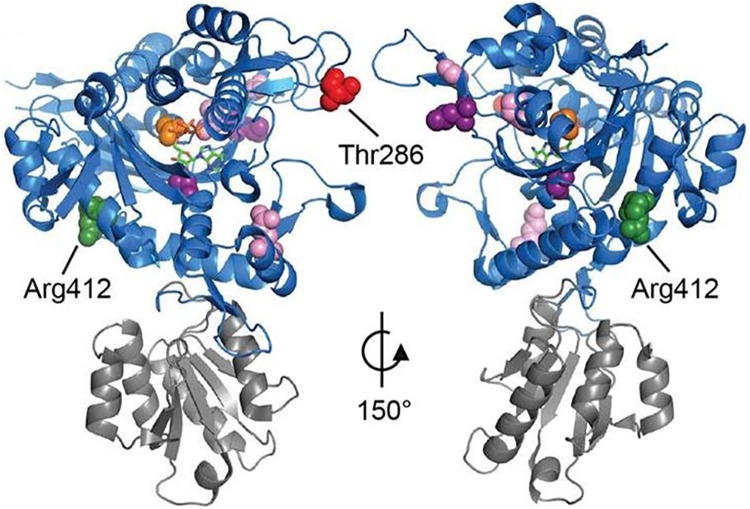
Fig 2. Relative position and conservation of GARS mutations.
Model of GARS protein structure showing catalytic domain (blue) and anticodon binding domain (grey). Residues mutated in the proband are displayed as red (Thr268) and green (Arg412) spheres. ATP (sticks) and glycine (orange spheres) are seen in the active site pocket. Pink and purple residues indicate previously reported pathogenic mutations in CMT2D and dSMA-V respectively [6,27,28]. Model based on PDB structure 2ZT7.

