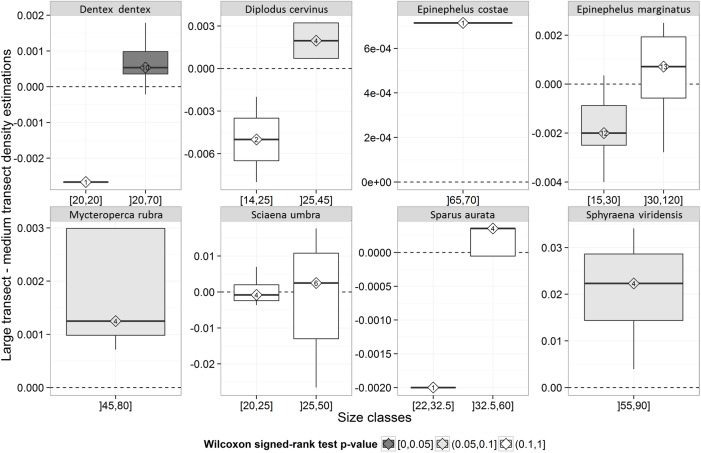
Fig 2. Tukey box plot comparing mean density estimates of large and medium transects. for two size classes of each species.
Numbers inside diamonds are the number of sites considered for the comparison (see text for details). The color of the box indicates the significance of the p values based upon Wilcoxon signed rank test. The bottom and top of the box are the first and third quartiles, the band inside the box is the median, the end of the lower whisker is the lowest datum within 1.5 interquartile range (IQR) of the lower quartile, and the end of the upper whisker is the highest datum within 1.5 IQR of the upper quartile

