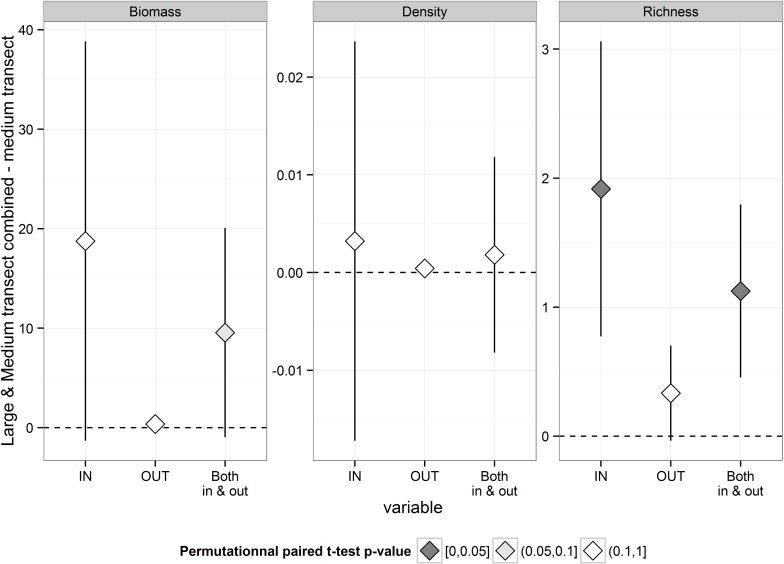
Fig 4. Comparison of mean density, biomass and species richness estimated by “Large and Medium transects combined” and by “Medium transects” for 8 species combined, at each protection level and at all at all sites combined.
Bars indicate 95% confidence intervals. The colour of the diamonds indicates the significance of the p values based upon permutational paired t-test.

