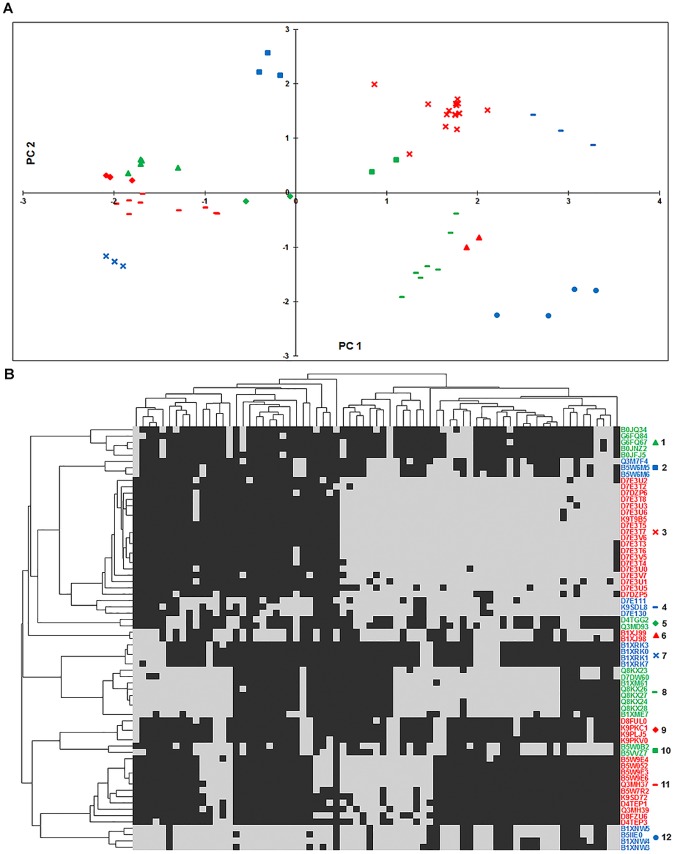
Fig 6. Clusters of Co-evolving Genes (CCG).
Twelve representative CCGs are shown in (A) PCA plot where principle component analysis (PCA) of all the semi-conserved profiles (genes) was performed to plot only the representative genes and (B) Heatmap. Genes of a cluster are color-coded in the two plots. Phylogenetic profiles of genes are clustered using hierarchical clustering with Hamming distance as the metric, average linkage and a cutoff of 0.15. The representative phylogenetic profiles (genes) are then clustered again to depict their relatedness. Organism clusters in the heatmap are based on their genome profiles depicting their evolutionary relationships. In the heatmap, grey and black colors indicate presence and absence of the gene, respectively. Details of the clusters are as follows: Cluster 1: transposase enzymes, Cluster 2: acetamidase/formamidase enzymes, Cluster 3: nitrogen fixation genes, Cluster 4: SH3 domain protein, Cluster 5: sodium symporter proteins, Cluster 6: phosphate ABC transporter proteins, Cluster 7: ATP synthase subunit enzymes, Cluster 8: hydrogenase enzymes, Cluster 9: CRISPR associated proteins, Cluster 10: TPR repeat-containing proteins, Cluster 11: gas vesicle proteins, Cluster 12: ABC transporter proteins.

