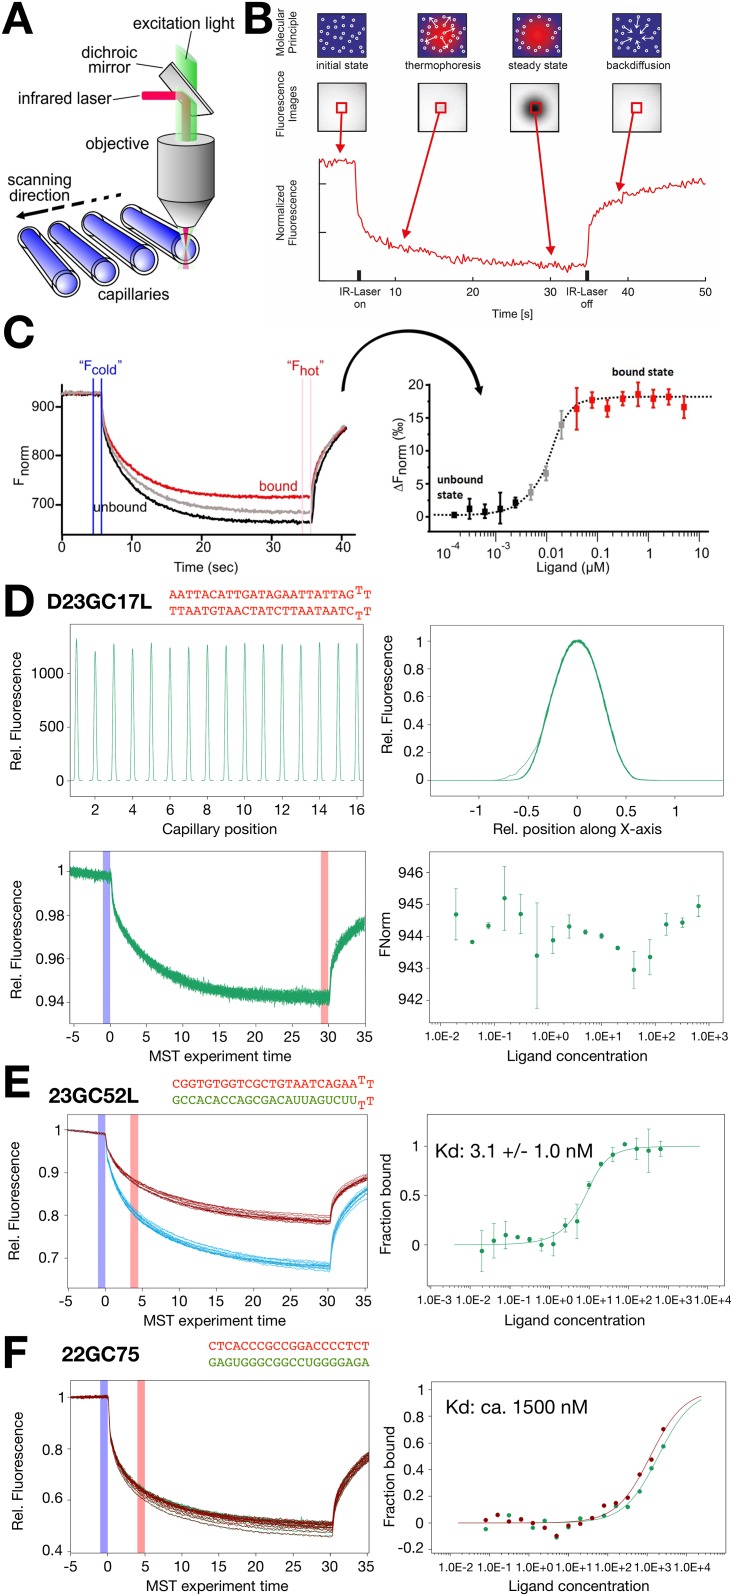
Fig 1. Determination of R-loop-antibody interactions by MST.
(A) The Technical setup of the MST technology is shown. The optics focuses in the center of the glass capillaries, thereby detecting the fluorescence signal of the labelled molecule. An IR-laser is used to establish a temperature gradient in the observation window of the optical system. Changes in fluorescence intensity are used to monitor thermophoretic movement of the molecules in solution. The concentration of the R-loop sequence is kept constant in our assays and the concentration of the antibody was varied. (B) A single MST time trace, showing the changes in fluorescence due to the movement molecules in a temperature gradient. After an initial cold phase (5 sec, laser off), the laser is switched on and instantly establishes the temperature gradient. After the T-Jump phase, in which the fluorescent dye decreases its signal yield due to heat induction, the thermophoretic movement starts. After 30 sec the IR-laser is turned off and the molecules diffuse back. (C) Interpretation of the results of a typical MST experiment. The MST time traces of 16 capillaries containing the same concentration of fluorescently labelled R-loop and an increasing concentration of the unlabelled S9.6 antibody used in our study are recorded and plotted in one graph (left panel). The normalized fluorescence of the MST traces is plotted against the concentration of the ligand (right panel). The data points are fitted to obtain the binding affinity. (D) MST data analysis of the double stranded DNA oligonucleotide D23GC17L, serving as a no binding control. The top-left panel shows the capillary scan to monitor potential sticking effects and absolute fluorescence signals. The overlay of the 16 capillary scan reveals a homogeneous curve shape, indicating no sticking (top-right). The bottom-left panel shows an overlay of 16 the recorded, normalized thermophoresis curves. As the DNA is not expected to bind the curves do perfectly overlap over the antibody concentration range of 640nM to 20pM. The bottom-right plot shows the normalized fluorescence Fnorm (‰) from T-Jump and Thermophoresis vs. the concentration of antibody. STDEV derives from two repeats. The signal does not significantly change, indicating no binding. (E) MST data analysis of the oligonucleotide 23GC52L, forming an R-loop. Two individual experiments performed at different MST power conditions (20% and 40%), creating a temperature gradient of either about 1.5°C or 3°C, are plotted (left panel). The right plot shows fraction bound calculation and the corresponding Kd fit. (F) MST data analysis of the oligonucleotide 22GC75, forming an R-loop. One set of thermophoresis curves of three independent experiments is plotted (left panel). The calculated fraction bound of two experiments is plotted, showing that full binding is not achieved. The binding affinity is estimated from the binding curves and given.

