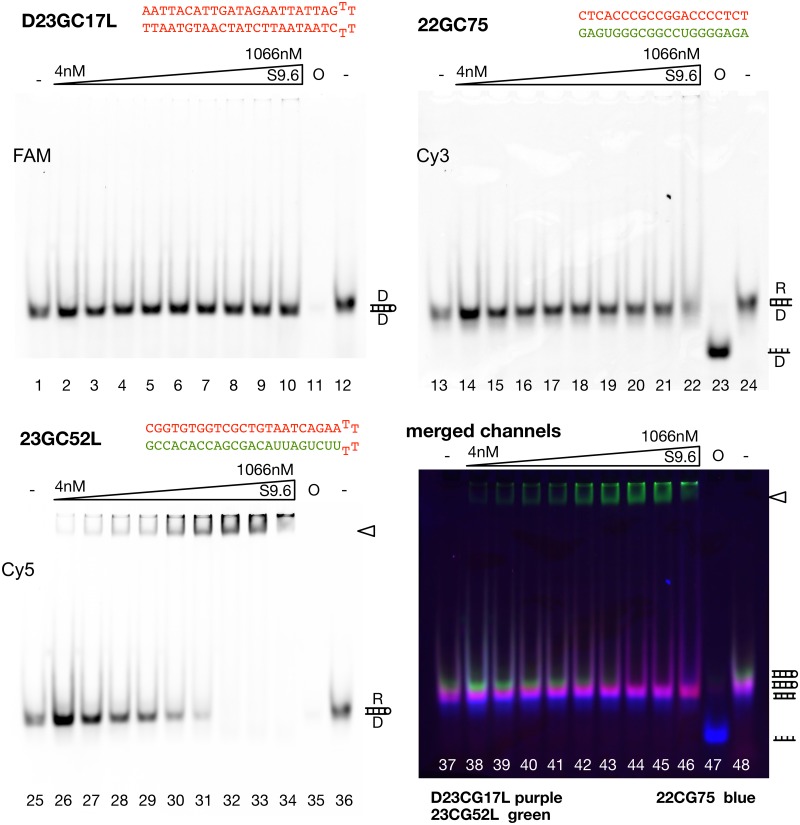
Fig 2. Analysis of R-loop-antibody-interaction by electromobility shift assays.
To directly compare the binding properties of different R-loops and to provide internal controls for the assay we use three different fluorescent labels. Oligonucleotides are either labelled with Cy5, Cy3 or FAM dyes, mixed in stoichiometric amounts and incubated with increasing concentrations of the S9.6 antibody. The channels of the fluorescence scans are given individually and as a merge (bottom-left panel). The R-loops and the DNA control used in Fig 1 were tested in EMSA. The mixture of substrates was incubated for 30 min with the increasing concentrations of S9.6 antibody (4nM to 1066nM) as indicated. Samples were separated on 8% native polyacrylamide gels. Lane 23 (47) reveals the migration behaviour of the single-stranded DNA (O: Oligonucleotide) for the R-loop substrate that was prepared from two individual molecules (22GC75). The triangle marks nucleic acid-antibody complexes. The positions of DNA and R-loop substrates is indicated on the right of the gel (D: DNA strand; R: RNA strand).

