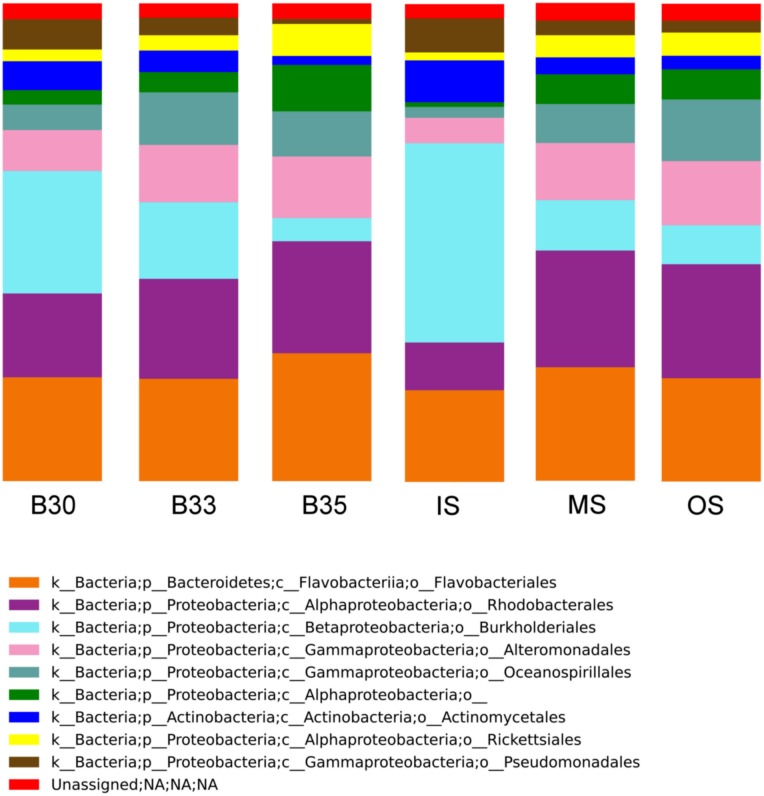
Fig 3. Microbial community composition in the water masses of the Estuary of Bilbao.
OTUs relative abundances per water mass were plotted. Each column shows the mean relative abundance of the top 10 most abundant orders per water sample (B30, B33, B35, IS, MS, OS) along the annual cycle (14 months). These bacteria account for the 68% of the total community.

