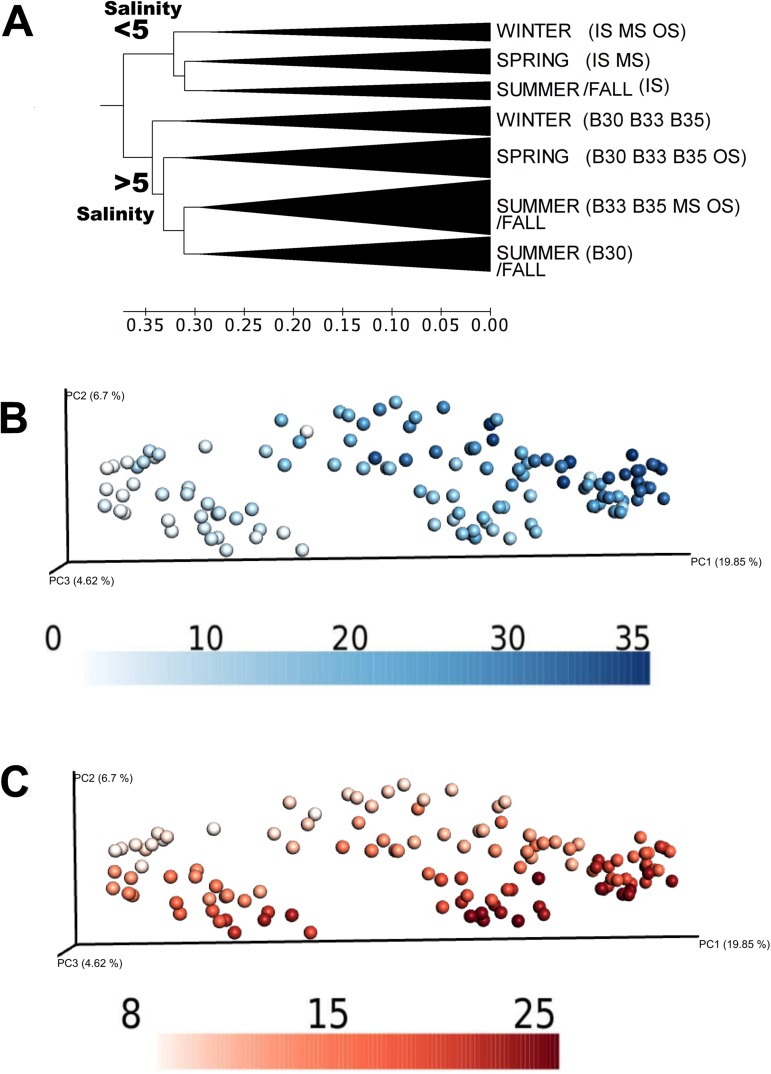
Fig 4. Dynamics and classification of bacterial communities of the Estuary of Bilbao.
A) UPGMA tree of the samples from the Estuary of Bilbao based on the unweighted UniFrac beta diversity distance matrix. Samples with a beta diversity distance less than 0.30 are collapsed into same branches. Seasons are defined according to the natural temporal changes in the northern hemisphere, considering winter (22 Dec-21 Mar), spring (22 Mar-21 Jun), summer (22 Jun-21 Sept) and fall (22 Sept-21 Dec). B) Unweighted UniFrac distance principal coordinate analysis (PCoA plot) colored by salinity gradient: from freshwater (0 ppt) to saline water (35 ppt). Darker signifies a higher salinity. C) Unweighted UniFrac PCoA plot colored by temperature gradient: from low temperature (from 8°C) to high temperature (to 25°C). Darker signifies a higher temperature.

