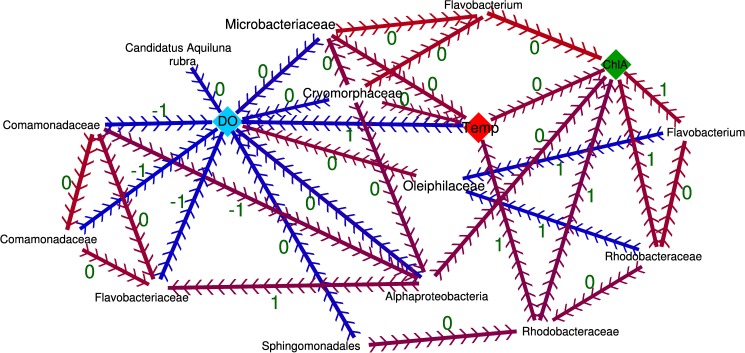
Fig 5. The OTUs significantly related with DO concentration, temperature, and chlorophyll concentration in B30 water mass through time.
eLSA analysis was conducted for the 14 time points (total sampling months in duplicate) of the B30 water mass samples. In analysis, the 85 most abundant OTUs and all the environmental features measured were included (salinity, temperature, precipitation, pH, turbidity, and chlorophyll and DO concentration). The matrix of the variables was normalized by ‘robustZ’ method. A network was created with Cytoscape software [45] using the significant (q < 0.01) correlations obtained in the eLSA analysis. The directionality of the relationship is marked with arrows with its temporal delay (in months) in the edge label (green) and the relation type between them positive (red) or negative (blue).

