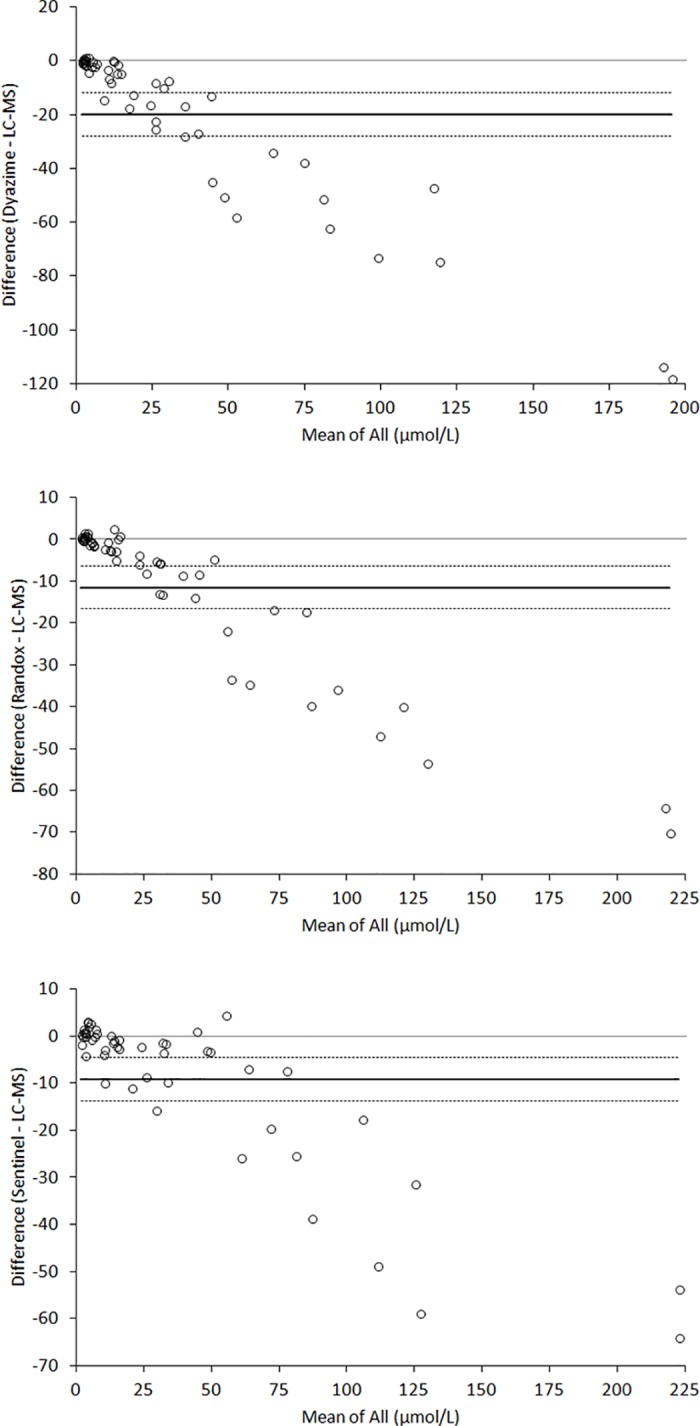
Fig 3. Bland and Altman plot analysis of three enzymatic techniques for measuring total bile acids in plasma compared to the reference liquid chromatography-mass spectrometry (LC-MS) assay.

The horizontal lines are drawn at mean (continuous line) and 95% confidence interval (95% CI; dotted lines) of bias.
