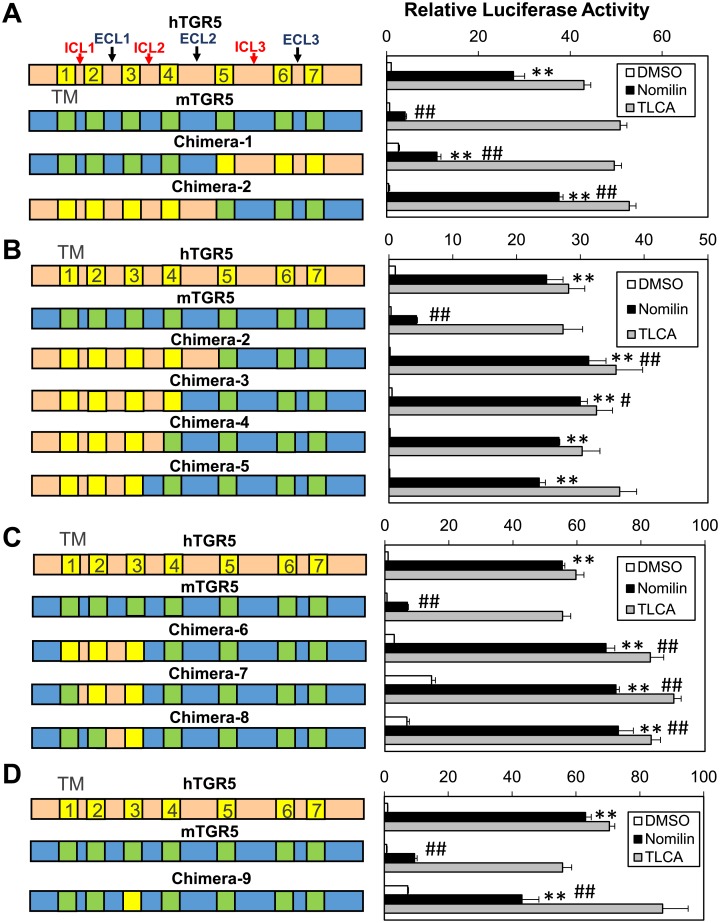
Fig 2. Nomilin and TLCA specificity of chimeric TGR5.
(A–D) Left panels show diagrammatic representations of chimeric TGR5. hTGR5 is shown in beige with yellow TM domains, and mTGR5 is shown in blue with green TM domains. Right panels show CRE-Luc response profiles to nomilin and TLCA (100 μM each) for corresponding hTGR5, mTGR5, and chimeric TGR5. Significant differences between the nomilin responses were analyzed using one-way ANOVA (Tukey’s post hoc test); **p < 0.01 for mTGR5-Nomilin; #p < 0.05 and ##p < 0.01 for hTGR5-Nomilin. The values represent the mean ± SD.

