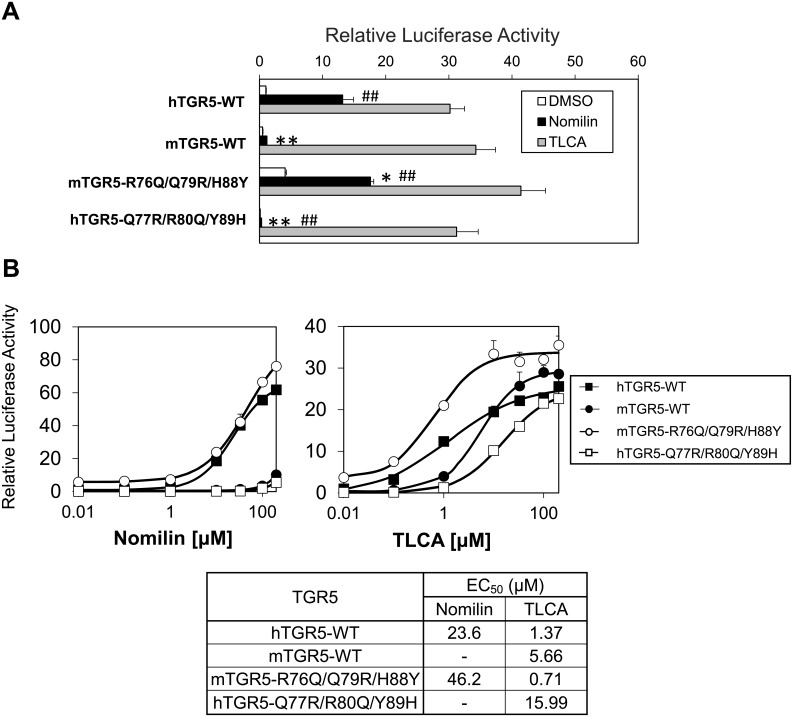
Fig 4. Differences in the affinity between hTGR5 and mTGR5 for nomilin as determined using three amino acid residues.
(A) Transient transfection assays using HEK293 cells with a CRE-luciferase reporter plasmid and an expression vector for TGR5 with the indicated mutation of three unconserved residues (n = 3). (B) Each WT and mutant TGR5 was transfected into HEK293 cells together with the CRE-luciferase plasmid, and dose-response curves to nomilin (left panel) and TLCA (right panel) were examined. The lower panel shows the EC50 values of each TGR5 for nomilin and TLCA (n = 3). Significant differences between the nomilin responses were analyzed using one-way ANOVA (Tukey’s post hoc test); **p < 0.01 and *p < 0.05 for hTGR5-WT; ##p < 0.01 and #p < 0.05 for mTGR5-WT. The values represent the mean ± SD.

