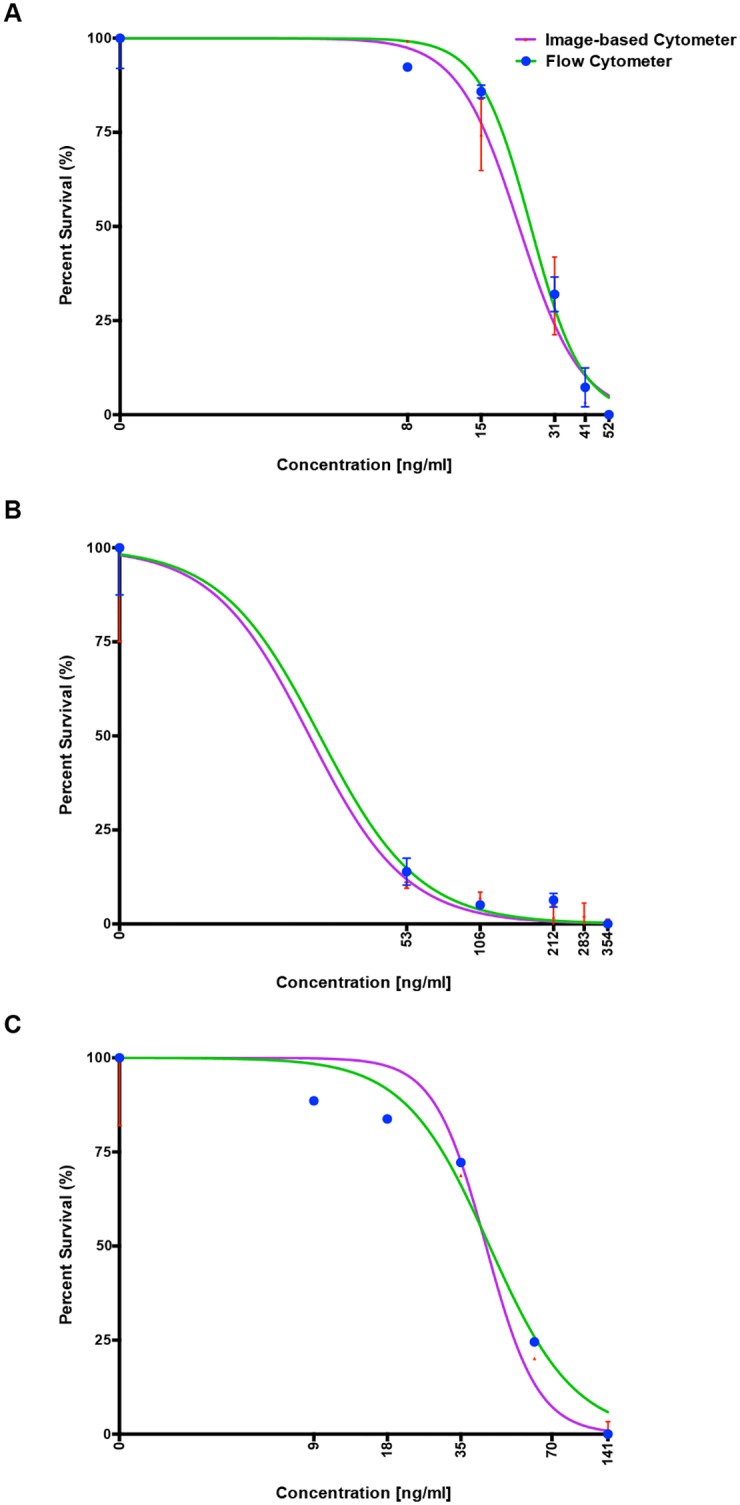
Fig 8. Comparison of dose response curves for the three antimalarial drugs generated using image-based cytometer and flow cytometer.

Well-known anti-malarials; (A) Chloroquine, (B) Artemisinin and (C) Cycloheximide were screened against the laboratory strain, 3D7. Standard growth inhibition assay was performed and IC50 values determined using our image-based cytometer and flow cytometry in parallel [Table 3], to obtain comparable results. The error bars represent standard errors.
