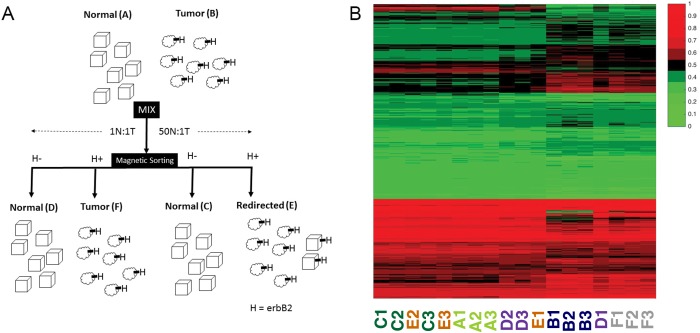
Fig 1. The experimental system and global gene expression pattern.
A: The experimental system consists of six cell groups; normal (A) and tumor (B) cells were mixed in either a 1:1 or 50:1 (normal:tumor) ratio and cultured for 4 days, then magnetically sorted based on expression of erbB2 into four resultant groups: normal (D) or tumor (F) from the 1:1 mixing and normal (C) and redirected tumor (E) from the 50:1 mixing; B: Heatmap of all transcripts present in the microarray, log2 expression values normalized by column; columns are identified at the bottom of the figure with their cell group classification and replicate number.

