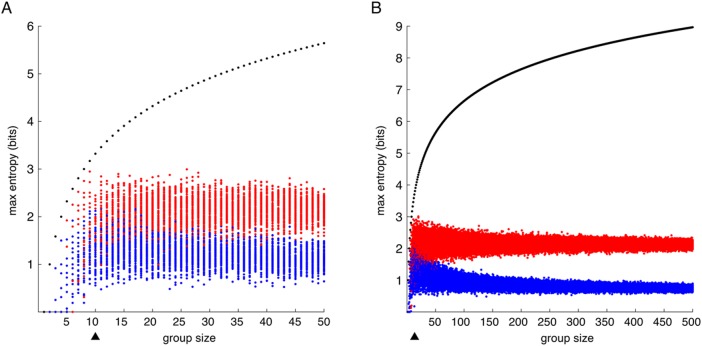
Fig 2. Mutual information performance and set size.
MI and entropy for molecular signatures of increasing size. Points in black represent maximum entropy for a given set size–maximum possible information; points in red are MI values of random samples sets from columns A1 and A2 of the GEM (likely to be more similar as they belong to the same cell group); blue measurements are from columns A1 and B1 of the GEM (likely to be less similar); Triangle markers represents the molecular signature size minimum used in our calculations; molecular signatures below this size were excluded from consideration. A: zoomed group size 1 to 50; B: a larger plot of group size 1 to 500.

