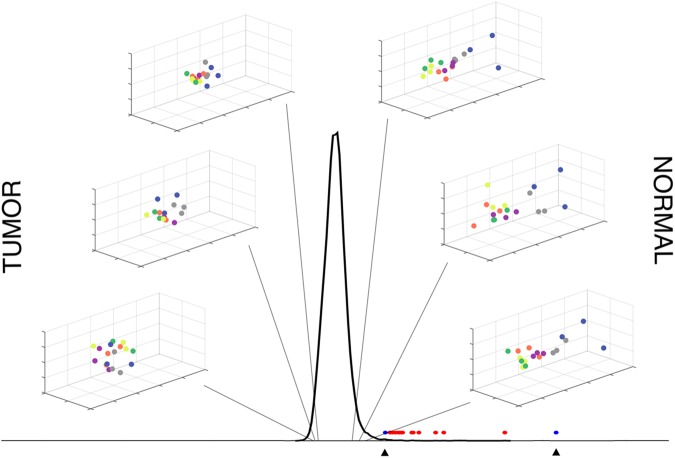
Fig 4. Molecular signature mutual information distinguishes cell groups.
The MI(A,E)/MI(E,B) distribution in the center is for all molecular signatures. The lower ratios to the left of the distribution represent molecular signatures where the redirected state (E) is closer to the tumor state (B); The higher ratios to the right of the distribution represent molecular signatures where the redirected state (E) is closer to the normal state (A). Sample molecular signatures in the 3D insets show cell group replicate differences at percentiles 1, 2, 5 (left column, bottom to top) and 95, 98, 99 (right column, top to bottom) of the MI ratio distribution. Molecular signature markers: red markers at the base of the distribution indicate the position of the significant molecular signatures along the distribution; blue markers and arrows indicate the position of the most adversely affected molecular signature after the addition of the extended genes (left marker, PID_CERAMIDE_PATHWAY) and the molecular signature with the most improved ratio after extension (right marker, REACTOME_SOS_MEDIATED_SIGNALLING).

