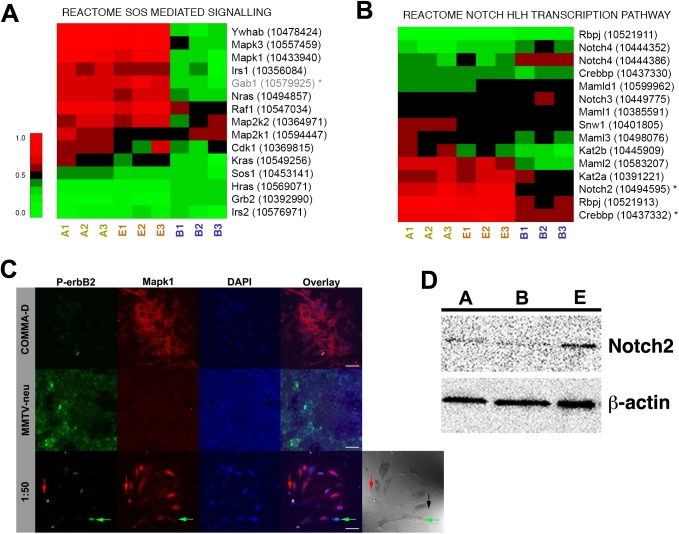
Fig 5. Representative cancer redirection molecular signatures.
Markers indicate genes with at least one transcript identified as significantly differentially expressed. Gene names in gray are those added by interaction with the original molecular signatures members. Heatmaps for all groups are available in Supplemental Dataset 1. (A) Molecular signature of the SOS mediated signaling pathway. (B) Molecular signature of the Notch HLH pathway. (C) Immunoflourescent staining of cells for P-erbB2 (green) and Mapk1 (red). Nuclei counterstained with DAPI. Scale bars = 40 μm. Lower right image is DIC image with Xgal stained lacZ+ cells evident. (D) Western blots probed for Notch2. β-actin used as loading control. A-Normal cell lysates, B-Cancer cell lysates, E-Lysates from 1:50 cultures.

