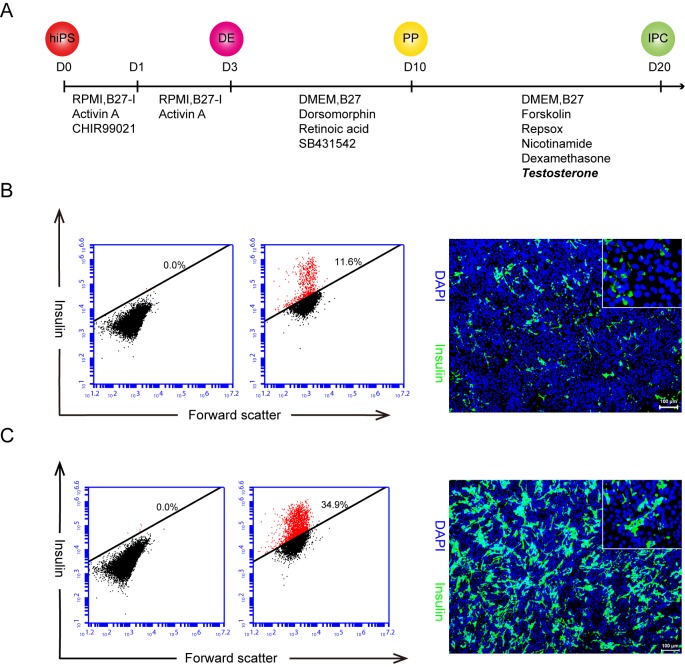
Fig 1. hiPSCs differentiated into insulin-producing cells by an optimized protocol.
A. The schematic outlines our modified hiPSCs differentiating to insulin-producing cells protocol with key time points and components added stages, 2 nM T was added from day 10 to day 20. hiPS: human induced pluripotent stem cells; DE: definitive endoderm; PP: pancreatic progenitor; IPC: insulin-producing cells. B. The control group, none T, but same volume of DMSO was added; C. Experiment group with T administration. The flow cytometry analysis revealed at day 20 that the rate of these insulin positive cells in the control group was 11.6% (B. left panel) versus the one of 34.9% in the experiment group (C. left panel); and this data was confirmed by the insulin antibody immunostaining (showed at the right panel of B and C) and the inserted magnifying image shows the clear cytoplasmic location of insulin. Similar results were obtained in at least three independent experiments. Scale bar = 100 μm.

