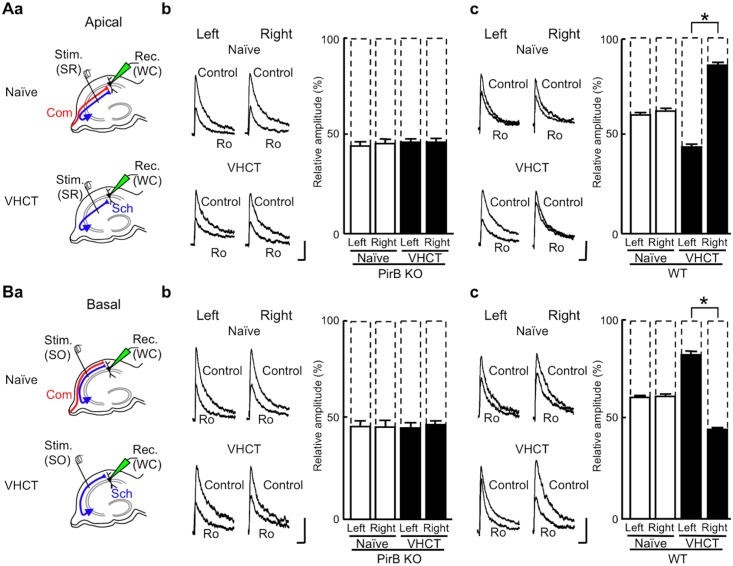
Fig 3. Inhibitory effect of Ro 25–6981 on NMDA EPSCs at CA1 pyramidal neuron synapses.
(Aa) Schematic diagrams showing synaptic inputs onto the apical dendrites of CA1 pyramidal neurons and the positioning of electrodes. In slices from naïve and VHCT mice, electrical stimuli applied at the stratum radiatum [Stim. (SR)] of area CA1 selectively activated apical synapses. Whole-cell recordings [Rec. (WC)] were made from CA1 pyramidal neurons. Sch, Schaffer collateral fibers; Com, commissural fibers. (Ab) Effects of Ro 25–6981 on NMDA EPSCs at CA1 apical synapses in the PirB KO hippocampus. Representative superimposed traces indicate NMDA EPSCs recorded in the absence (Control) or presence of Ro 25–6981 (Ro, 0.6 μM). The levels of inhibition were maximal after exposure to Ro 25–6981 for 50 to 60 min. “Left” and “Right” indicate recordings from left and right hippocampal slices, respectively. Each trace is the average of five consecutive recordings. Scale bars: 25 pA (vertical) and 100 ms (horizontal). Relative amplitudes of NMDA EPSCs in the presence of Ro 25–6981 are expressed as percentages of control responses. Error bars represent SEM (n = 7 each; P > 0.05 for all combinations, Student’s t-test). (Ac) Effects of Ro 25–6981 on NMDA EPSCs at CA1 apical synapses in the WT hippocampus. Relative amplitudes of NMDA EPSCs in the presence of Ro 25–6981 are expressed as percentages of control responses (mean ± SEM; n = 7 each; *P < 0.05; absence of an asterisk indicates P > 0.05). (Ba) Schematic diagrams showing synaptic inputs onto the basal dendrites of CA1 pyramidal neurons and the positioning of electrodes. Whole-cell recordings [Rec. (WC)] were made from CA1 pyramidal neurons. To activate basal synapses, electrical stimuli were applied at the stratum oriens [Stim. (SO)] of area CA1. (Bb) Effects of Ro 25–6981 on NMDA EPSCs at CA1 basal synapses in the PirB KO hippocampus. Representative superimposed traces indicate NMDA EPSCs recorded in the absence (Control) or presence of Ro 25–6981 (Ro, 0.6 μM). “Left” and “Right” indicate recordings from left and right hippocampal slices, respectively. Scale bars: 25 pA (vertical) and 100 ms (horizontal). Relative amplitudes of NMDA EPSCs in the presence of Ro 25–6981 are expressed as percentages of control responses (mean ± SEM; n = 7 each; P > 0.05 for all combinations). (Bc) Effects of Ro 25–6981 on NMDA EPSCs at CA1 basal synapses in the WT hippocampus. Relative amplitudes of NMDA EPSCs in the presence of Ro 25–6981 are expressed as percentages of control responses (mean ± SEM; n = 7 each; *P < 0.05; absence of an asterisk indicates P > 0.05).

