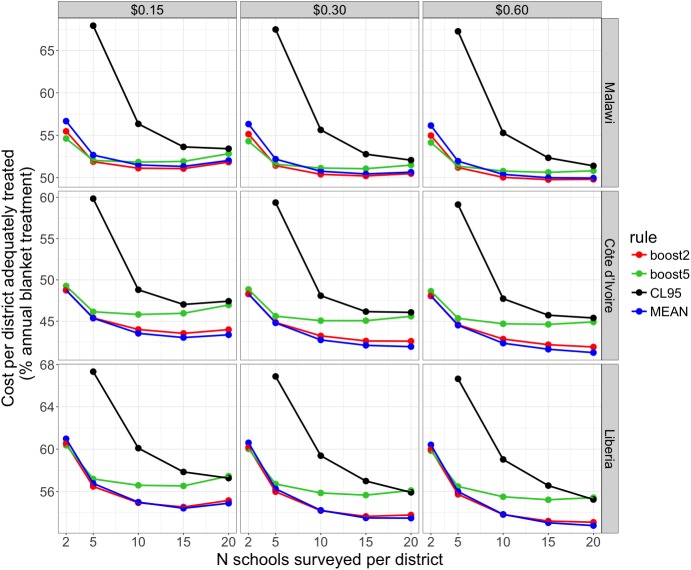
Fig 8. Effect of variation in per capita PZQ treatment costs (0.15 to 0.60 USD) and the country source of simulation results on estimates of mapping survey cost-efficiency.
Cost-efficiency is expressed as the cost per district adequately treated, as a percentage of the annual blanket treatment cost for a district. Line colour indicates the district classification rule used (blue: point prevalence estimate; red: 2% boost at thresholds, green: 5% boost at thresholds, black: upper 95% confidence limit). All plots relate to surveys where 30 children were sampled per school. Data points for surveys using 2 schools per district and assignment using the upper 95% confidence limit (which all produced very high values, >90% on the y-axis) are not shown, to improve clarity in the lower range of the y-axis.

