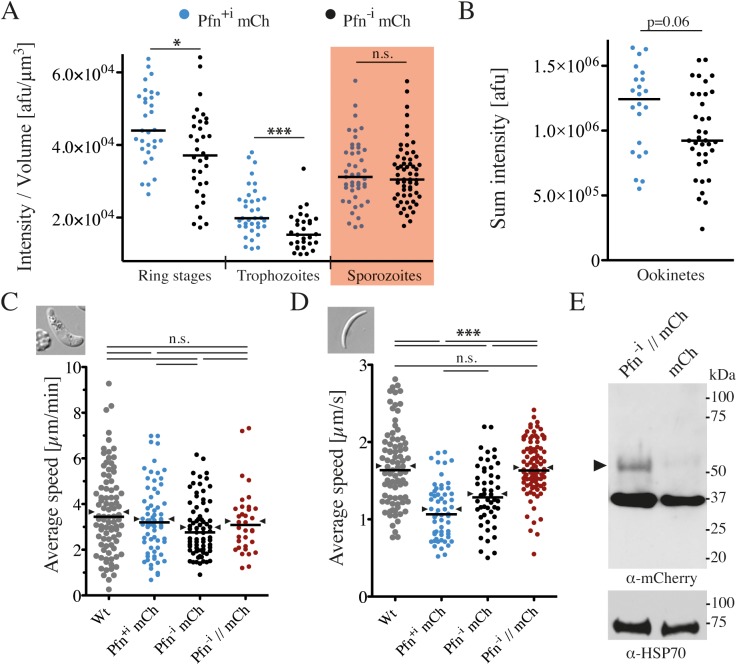
Fig 1. Fluorescent tagging and absence of introns can impact profilin function.
(A) Quantification of profilin-mCherry fluorescence per volume in ring stages, trophozoites and sporozoites (red shading). Each dot represents the fluorescence intensity normalized to parasite volume for one parasite. Horizontal bar: median. Significances were tested with Mann-Whitney tests; * denotes p<0.05; *** p<0.001.(B) Quantification of total profilin-mCherry fluorescence intensity of ookinetes. Note that fluorescence was much stronger in the nucleus of ookinetes (S3B Fig) and thus ookinetes were not directly comparable with other stages. Significance was tested with a Mann-Whitney test. (C, D) Average speed with median (line) and mean (arrowheads) of ookinetes (C) and sporozoites (D) from the different parasite lines; Wt: wild type; Pfn+i mCh: Profilin-mCherry with introns; Pfn-i mCh: Profilin-mCherry without introns; Pfn-i // mCh: Profilin-mCherry without introns and long linker, which is cleaved (see panel E). At least 50 parasites per line were tracked over at least half of the acquisition time (sporozoites: 5 min, ookinetes: 15 min); significance was tested with a Kruskal-Wallis test; *** denotes p<0.001. (E) Western blot showing a weak band for the profilin-mCherry fusion protein (arrowhead) and a major band for a cleaved mCherry of the parasite line expressing profilin-mCherry with a long linker (Pfn-i // mCh) detected with an anti-mCherry antibody in blood stage schizont lysates (lane 1). Note that at least 75% of profilin-mCherry is cleaved. Lane 2: control line expressing only mCherry. Loading control: anti-HSP70.

