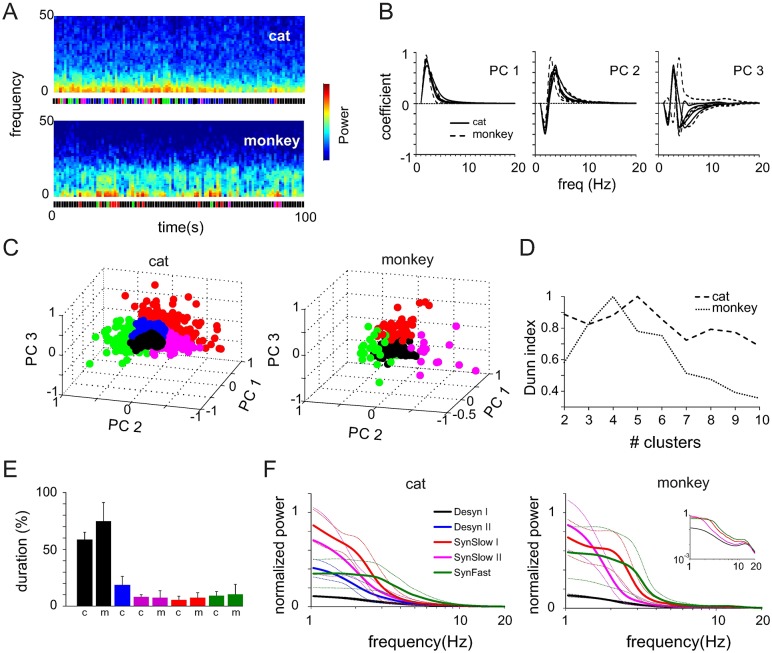
Fig 1. Separation of cortical states in spontaneous activity of anesthetized cat and awake monkey.
(A) LFP spectrograms of two 100s segments computed with non-overlapping windows of 1s. Bottom: colored bars indicate cortical state as defined in the main text. (B) Coefficients for first three principal components as a function of power spectrum frequency. (C) Principal component space for two entire datasets (cat: 6000s, monkey: 600s). Each circle represents a data segment of 1s duration. Colors indicate different cortical states. (D) Dunn index as a function of the cluster number extracted by k-means. (E) Average (+SD) duration of different states across all datasets of a species. (F) Average power spectrum of different cortical states for all cat and monkey datasets. Dashed lines indicate standard deviation (±SD). Inset: same as in main figure, but in log-log coordinates to show peak in alpha band.

