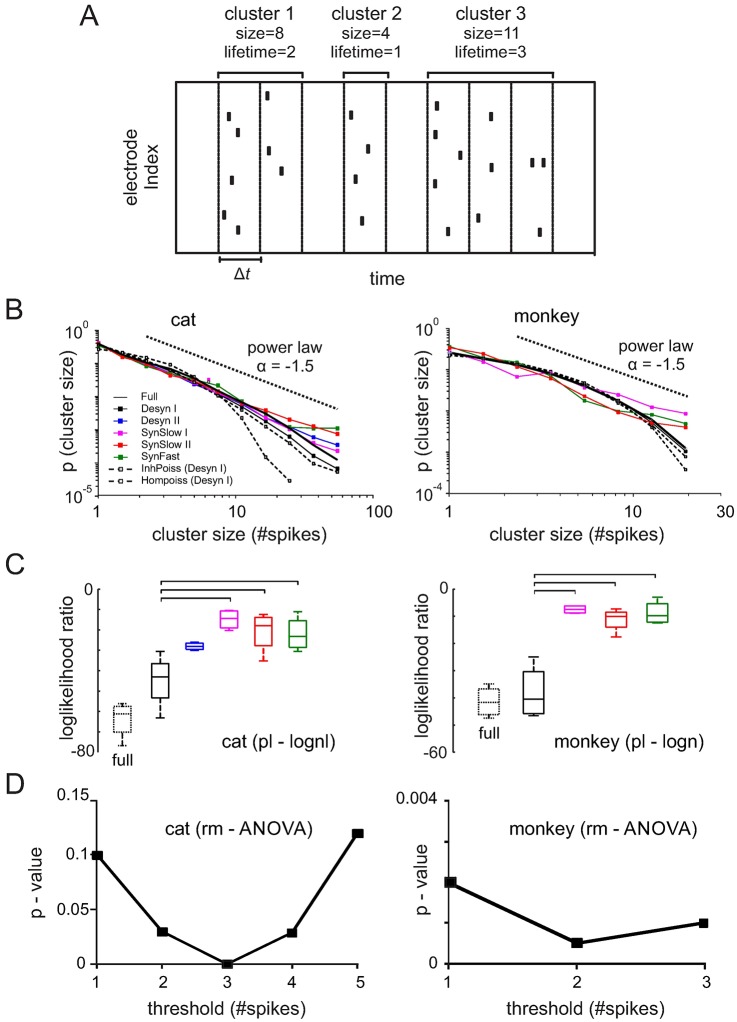
Fig 3. Neuronal avalanche analysis of spiking activity.
(A) Spike clusters were defined as a sequence of bins containing spikes ≥1 threshold (in this example threshold = 1). The size of a spike cluster is given by the total number of spikes within a cluster. The lifetime of a cluster is defined as the number of bins. Δt was chosen as the average ISIpop interval of the population spike train for each state. (B) Cluster size distributions of different states. Dotted black lines indicate power law with exponent = -1.5. Dashed lines with gray squares represent an inhomogenous Poisson process created from the desynchronized I state by spike time randomization within all 1s segments. Dashed lines with empty squares indicate homogenous Poisson process with the same rate and duration as the entire desynchronized I state. (C) Loglikelihood ratios for power law and lognormal fits to cluster size distributions of different cortical states across all cat (threshold: 3 spikes) and monkey data (threshold: 2 spikes). Negative values indicate a better lognormal fit. Horizontal bars: significant Bonferroni multiple comparison test. (D) Significance between different states expressed as the p-value of an rm-ANOVA test for different thresholds defining a cluster.

