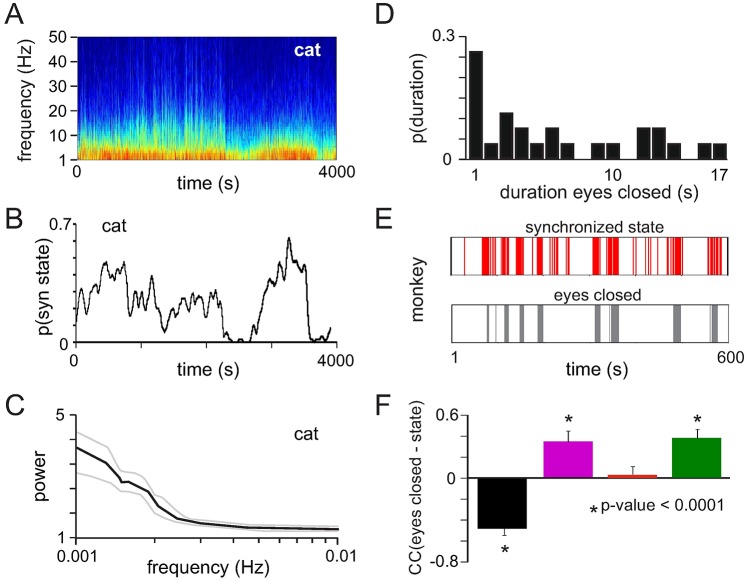
Fig 6. Evolution of cortical states over time.
(A) LFP spectrogram of an entire recording in one cat calculated with non overlapping windows of 1s duration (top) and the probability of synchronized states (synchronized slow I, II and synchronized fast states) computed with a sliding window of size 100s and an overlap of 1s (bottom). (B) Average power spectrum (SEM: dashed lines) of the time courses of synchronized states across all four cats. (C) Probability to find periods of eye closure with a given duration across all monkey datasets. (D) Time course of synchronized states (synchronized slow II and synchronized fast) (top) and periods of full eye closure (bottom) in one monkey dataset. Vertical bars represent 1s time segments. (E) Pearson correlation coefficient calculated between the time course of eyes closure and the time courses of different cortical states.

