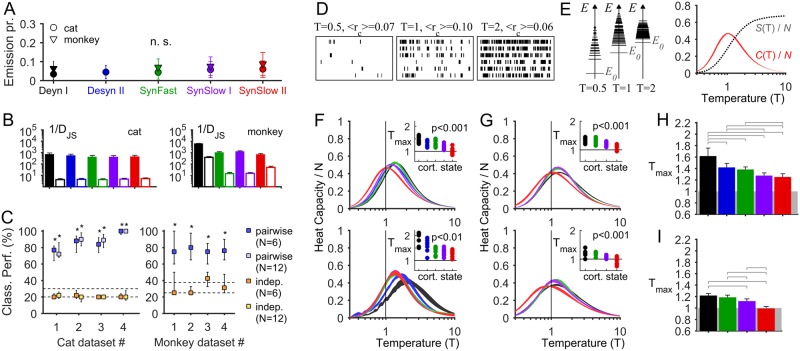
Fig 7. Maximum entropy models (MEMs) of different cortical state.
(A) Probability that an electrode site i has σi = +1 (emission probability) using the bin sizes indicated in Table 2 (error bars indicate SEM). The emission probabilities do not significantly depend on the cortical state (p = 0.092 for cat data, p = 0.058 for monkey data, rm-ANOVA). (B) Goodness-of-fit (1/DJS) of pairwise-MEMs (filled bars) and independent-MEMs (open bars) for each cortical state (averaged over the 10 groups of N signals and all datasets; error bars indicate SEM). (C) Prediction of the cortical state using pairwise- and independent-MEMs. The percentage of correct classifications is shown for each cat (left) and monkey (right) dataset. Squares indicate the medians and error bars delineate the 5–95th percentiles of the classification performance. Dash lines: mean and 95th percentile of the number of correct classifications expected by chance. *: significant classification performances (p < 0.05). (D–E) Effect of changing the temperature parameter T on the model activity. The MEM in this example was estimated using the activity of a neural ensemble of the cat in the SynSlow II state. D: model activity (1000 steps are shown out of 106 steps). At low temperature (T = 0.5) the activity is sparse and correlations are low (<rc> = 0.07); at high temperature (T = 2) the activity is dense and random and correlations are low (<rc> = 0.06); for an intermediate temperature (T = 1) the activity is more patterned and correlations are higher (<rc> = 0.10). E: Left, occupied energy levels. The size of the horizontal lines is proportional to log(nE), where nE is the number of patterns that have the energy E. Right, the entropy S(T) increases with T and the heat capacity C(T) peaks at a given temperature Tmax (for this particular example neural ensemble Tmax = 1). (F–G) Heat capacity as a function of the temperature parameter (T), for each cortical state, for two example anesthetized cat datasets (F) and two example awake monkey datasets (G) (10 random choices of groups of N signals were used; trace thickness indicates SEM). Inset: Peak temperature (Tmax) for each neuronal ensemble and for each cortical state. Tmax significantly depends on cortical state (p: p-value, rm-ANOVA). (H–I) Tmax averaged over all cat datasets (H) and over all monkey datasets (I) for each cortical state (rm-ANOVA: H: F4,156 = 25.03, p < 0.001, ε = 0.34; I: F3,117 = 59.60, p<0.001, ε = 0.90). Error bars indicate SEM. Horizontal bars: significant differences (p < 0.05) of subsequent Bonferroni's test for multiple comparisons. In A–I the size of the models was N = 6.

