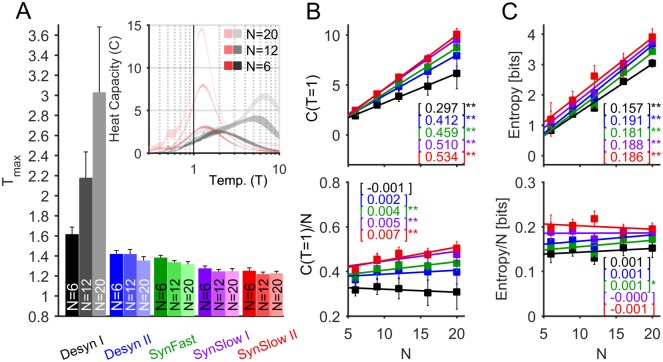
Fig 8. Heat capacity and entropy as a function of ensemble size.
(A) Peak temperature (Tmax) averaged across anesthetized cat datasets for each cortical state and for ensembles of different sizes N. This analysis was restricted to cat datasets, for which more electrodes and longer recordings were available (datasets #1–4 for N ≤ 12 and datasets #1–3 for N > 12). Inset: heat capacity functions for Desyn I (gray scale) and SynSlow II (red scale) for an example cat dataset. (B) Magnitude of the heat capacity, C (top), and specific heat capacity, C/N (bottom), evaluated at T = 1 for different ensemble sizes N. For all tested N, the heat capacity was significantly cortical-state-dependent (p < 0.05, rm-ANOVA). (C) Entropy (top) and specific entropy (bottom) as a function of N. For all tested N, the entropy was significantly cortical-state-dependent (p < 0.05, rm-ANOVA). In both (B) and (C) lines indicate least-squares linear fit, for which the slopes are showed in the brackets and the asterisks indicate slopes significantly different from zero (*: p < 0.05, **: p < 0.01), and error bars indicate SEM.

