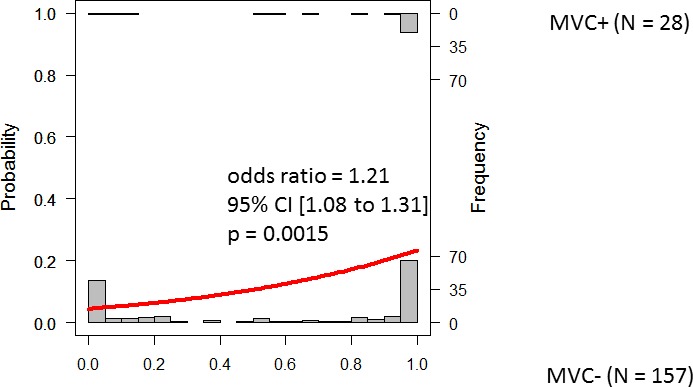
Figure 4.

Histograms of future MVC with fitted logistic regression line. The histograms in the top and bottom part represent the possibility of a future MVC in the MVC+ and MVC− groups, respectively. This Figure shows the results obtained with the predpenSVM_all model; this model included up to 84 variables (as shown in Table 2).
