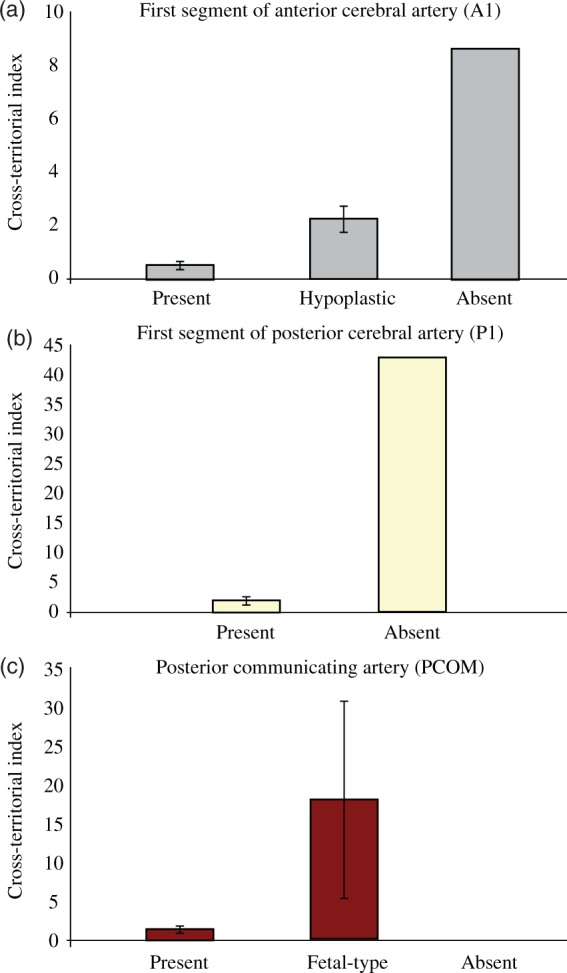
Figure 3.

(a) When sizes of the A1 segment of the ACA are grouped into three categories (present, hypoplastic, and absent), there is an observable difference between the corresponding mean cross-territorial indices for ICA–ICA overlap across hemispheres. (b–c) Similarly, when sizes of the P1 segment of the PCA and PCOM are grouped, there is an observable difference between the corresponding mean cross-territorial indices for ipsilateral ICA–VBA overlap. Note: the scale of the y-axis is different between graphs.
