Figure 6.
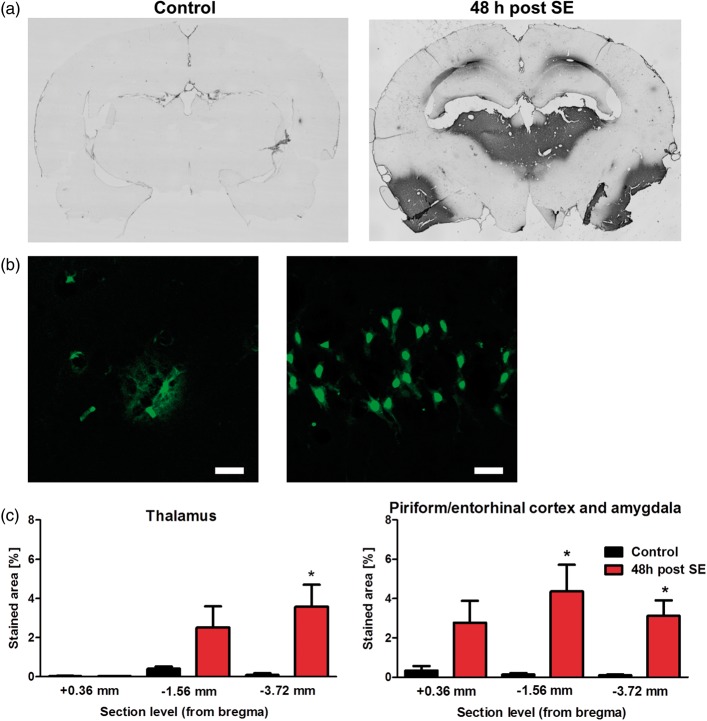
Histological evaluation of albumin extravasation. (a) Representative brain sections of a control rat and a rat 48 h post status epilepticus (SE) after conversion of FITC-albumin with peroxidase-conjugated anti-FITC and nickel-enhanced DAB into a light-microscopically analyzable reaction product at about −3.72 mm relative to bregma. (b) Representative images from hippocampus at 48 h post SE generated by confocal laser-scanning microscopy revealing FITC-labeled albumin extravasation from brain capillaries (left, scale bar indicates 50 µm) and cellular uptake (right, scale bar indicates 25 µm). (c) Quantification of stained area relative to the total section area at +0.36, −1.56, and −3.72 mm relative to bregma. Data are presented as mean ± SEM. *p < 0.05 compared to control, two-tailed Student’s t-test.

