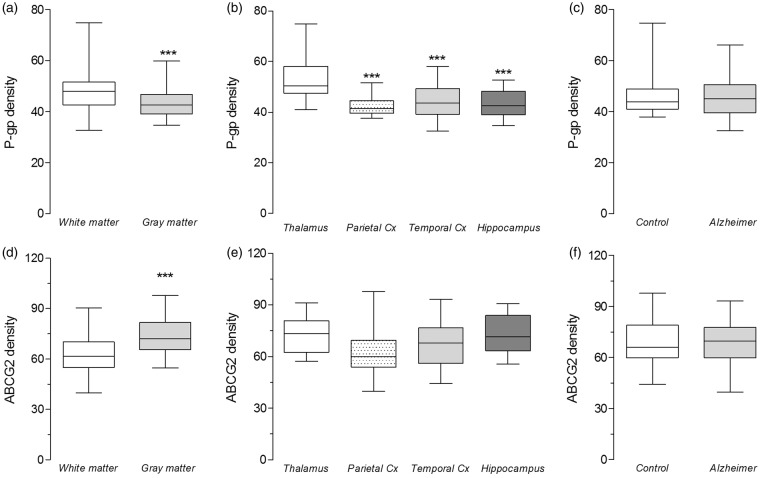
Figure 3.
On a “global” level, P-gp and ABCG2 densities vary substantially with brain matter and/or region, but not case status. Density was calculated from the average fluorescence intensity within capillary pixels. (a–c) Analysis using a linear regression model on log-transformed data provided evidence that P-gp expression: (a) is 9% lower in gray matter than in white matter, (b) is 19% lower in parietal cortex, 15% lower in temporal cortex, and 17% lower in hippocampus. (c) The model did not provide any evidence for differences in P-gp expression between the AD and control groups. (d–f) Linear regression model performed on ABCG2 data indicated that ABCG2 expression is: (d) 33% higher in gray matter than in white matter, (e) but is not different between regions or (f) between the AD and control groups. Data are shown as box and whisker plots, indicating 75th percentile, median, and 25th percentile (boxes), and minimum and maximum values (whiskers). Asterisks designate raw P-values (not adjusted for multiple testing) to provide an indication of a parameter’s influence on the dependent variable.

