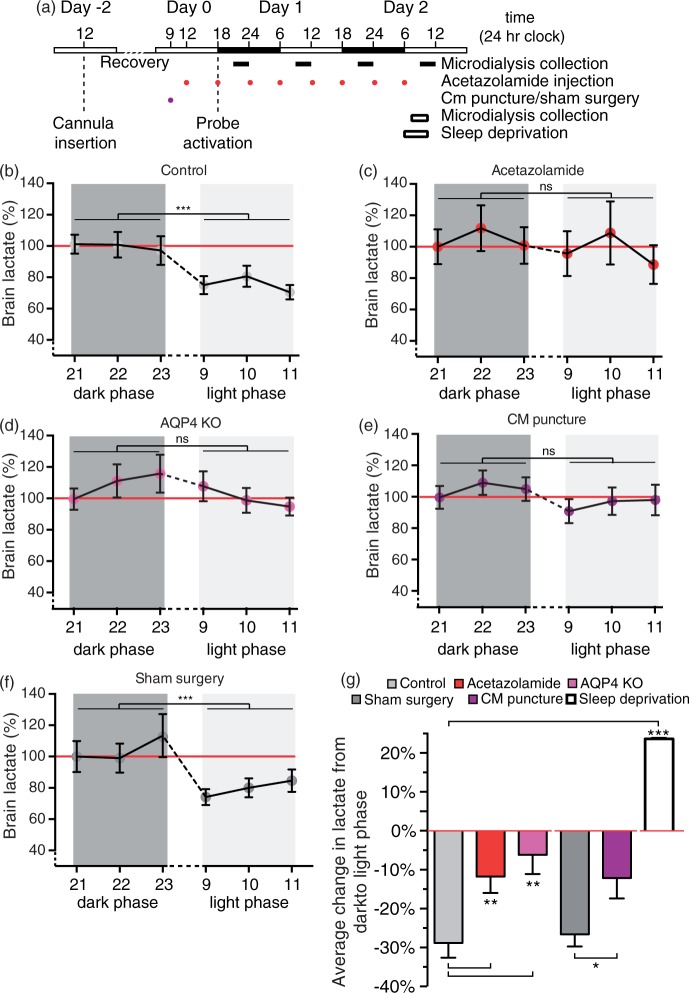
Figure 2.
Brain lactate during wakefulness, sleep and sleep-deprivation. (a) Schematic representation of microdialysis experiment. Lactate concentration in cingulate cortex during wakefulness and sleep state in (b) control mice (c) treated with acetazolamide, (d) AQP4 KO mice, (e) CM puncture, and (f) sham surgery. Values are shown as average of three collections per hour, N = 9 representative sleep/wake cycles. ***P < 0.001; ns, not significant; two-way ANOVA. (g) Percentage average change in lactate concentration of mouse cortex in the awake state (21:00–24.00) or sleep (9:00–12:00) deprived state compared to the awake state (red line). N = 16, 15, 7, 15, 21, and 3 for control sleep, acetazolamide treated, AQP4 KO, sham surgery, CM puncture and sleep deprivation, respectively. **P < 0.01, ***P < 0.001, one-way ANOVA followed by Dunnett's test compared to control. *P < 0.05, t-test for comparison of sham surgery and CM puncture. Bar graphs represent mean ± SEM.

