
Figure 3.
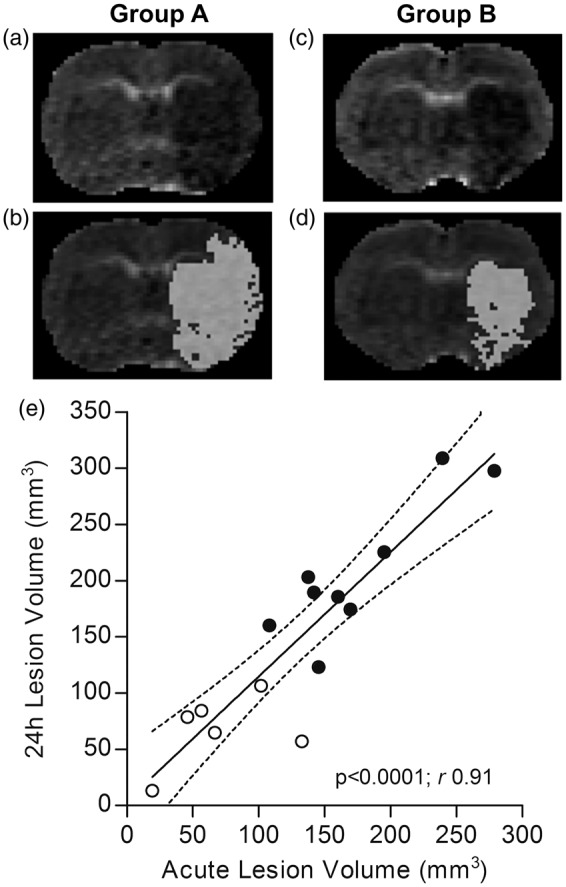
Evaluation of acute ischemic lesion on DWI-MRI and correlation with 24-h ischemic lesion. Representative ADC maps showing a large hemispheric (a) and basal ganglia (c) lesion, visible as hypointense areas (same animals as in Figure 2). Corresponding segmentation masks of the lesion (viability threshold value 0.53 × 10⁻³ mm2/s) are superimposed on the ADC maps (b and d). (e) Acute lesion volumes positively correlate with 24-h lesion volumes, with a slope of 1.11 ± 0.14. Dotted lines represent the 95% confidence interval of the regression line. Black spots = Group A animals (n = 9); White spots = Group B animals (n = 6). DWI = diffusion-weighted imaging; MRI = magnetic resonance imaging; ADC = apparent diffusion coefficient.