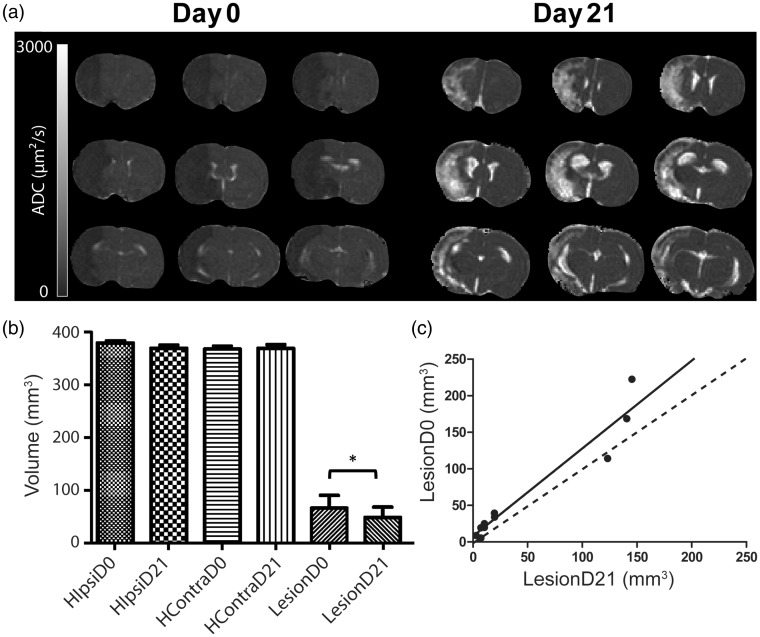
Figure 2.
(a) Evolution of the apparent diffusion coefficient (ADC) map of a rat brain from one animal during middle cerebral artery occlusion at day 0 (D0) and 21 days after (D21). (b) Volume of the cerebral hemispheres: Ipsilateral (HIpsi) and contralateral to the lesion (HContra) at D0 and D21, and volume of the altered zone detected by diffusion MRI during middle cerebral artery occlusion. Region of interest (ROI) LesionD0 at day 0 and at D21 (LesionD21) over the nine slices of ADC map. *Difference between the MR diffusion alteration volume at D0 and D21 detected by Wilcoxon Signed-Rank test (p = 0.02). (c) Correlation between the volumes of ROI Lesion at day 0 and day 21 r2 = 0.93, p < 0.001, y = 1.202x + 7.435 (n = 10).

