Figure 1.
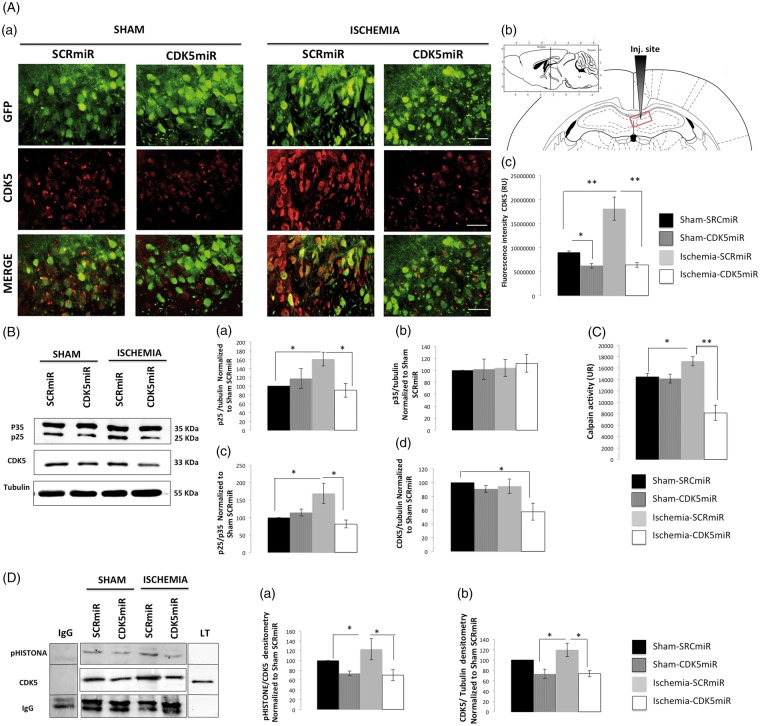
CDK5miR reduces CDK5 and p25 expression as well as prevents CDK5 and calpain activity at four months post-ischemia. (A) Representative photomicrographs of CDK5 expression in sections of the anterior portion of area CA1 (bregma −2.56). (a). The green fluorescent protein (GFP) signal represents the transduced CA1 cells in the ipsilateral hemisphere. The sections were photographed at 40 × , scale bars = 15 µm (40×). The animals were sacrificed four months after they received a unilateral injection with either CDK5miR or SCRmiR into the right CA1. (b) Identification of the injection site. (c). Quantification of the fluorescence intensity of CDK5 immunoreactivity in transduced neurons using Image Scope Pro software (Media Cybernetics). The fluorescence intensity was quantified over a total area of 1.2288 mm2 (40×); n = 4–6, **p < 0.001. (B) Representative Western blots of CDK5, p35, and p25 expression in CA1 samples collected from the animals treated with SCRmiR and CDK5miR (a, b, d). The p25/p35 ratio was determined (c). The densitometric quantification was expressed relative to the loading control (tubulin) and was normalized to the internal control (SCRmiR-treated sham rats). The values are presented as the mean ± SEM. (C) Calpain activity was measured in the ipsilateral CA1 region. n = 4 to 6, *p < 0.05, **p < 0.001. (D) The ipsilateral CA1 was dissected, and CDK5 kinase activity was detected using a phosphorylated histone antibody. A band corresponding to the IgG heavy chain was detected. Densitometric quantification was performed. pHISTONE expression was expressed relative to the total CDK5 from lysates (a), which was normalized to the loading control (tubulin) (b). n = 4 to 6, **p < 0.001. CDK5, cyclin-dependent kinase 5; RU, relative units; SCR, scrambled RNA sequence.

