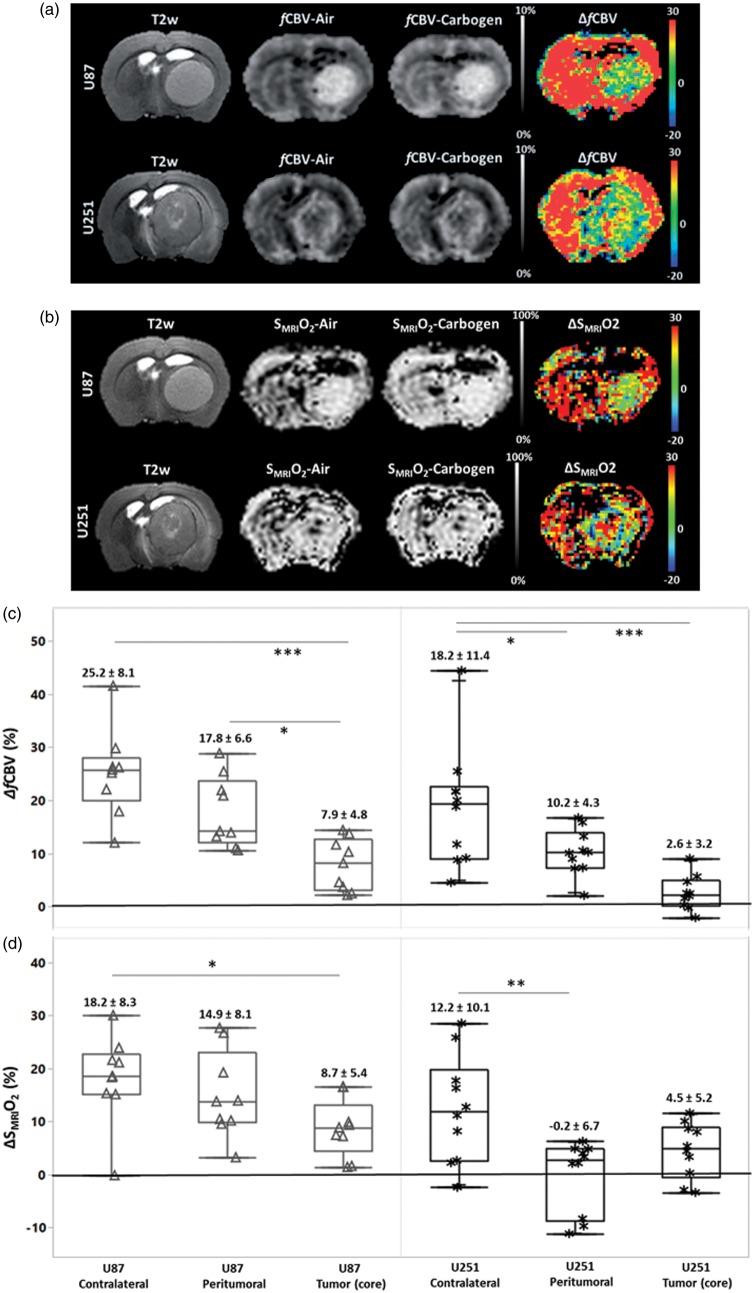
Figure 3.
Carbogen-induced changes in fCBV and SMRIO2. Composite images (anatomical T2w, fCBV (a) and SMRIO2 (b) under air, carbogen ventilation, and corresponding delta maps expressed as a percentage) in the two models of glioma. The box plots (c–d) illustrate quantitatively the percentage changes from baseline condition induced by carbogen in cerebral blood volume and O2 saturation respectively and statistical differences between tissues. The corresponding means and standard deviations are noted above the box plots.

